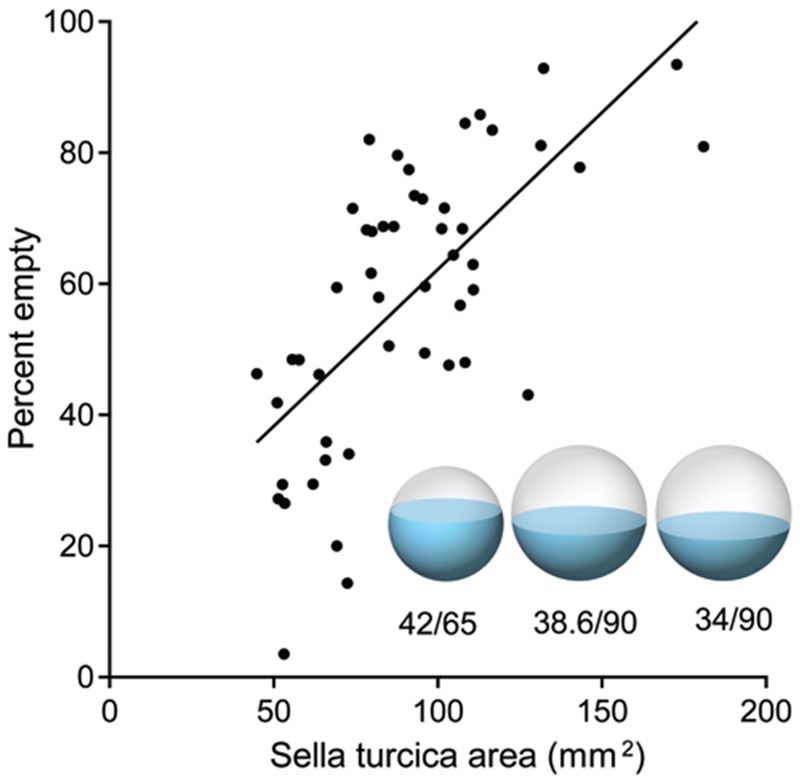
Fig. 3.

Scatter plot of sella turcica area versus percent empty sella for patients with pseudotumor cerebri. There is a correlation (r = 0.67), suggesting that the sella appears partially empty because it is enlarged. The spheres represent the mean sellar volume, and blue shading indicates pituitary gland volume. The left sphere depicts control subjects, with a mean sellar area of 65 mm2 and a mean gland area of 42 mm2. The middle sphere shows pseudotumor patients, with a mean sellar area of 90 mm2. The gland size is a prediction, which was made by calculating the cross-sectional area (38.6 mm2) that would result if the gland volume in pseudotumor patients remained equal to that in controls. The right sphere shows pseudotumor patients with their actually measured gland cross-sectional area (34 mm2).
