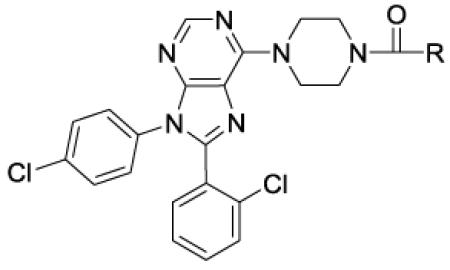
Table 2.
In vitro data for CB1 antagonists - amides

| ||||||
|---|---|---|---|---|---|---|
| # | R | Ke hCB1 (nM) |
Ki hCB1 (nM)a |
Ki hCB2 (nM)a |
Selectivity Ki CB2/CB1 |
MDCK-mdr1 A to B (%)b |
| 29 | Me | 120 | ||||
| 30 | CF3 | 0.4 | 1 | 130 | 130 | 500 |
| 31 | n-Bu | 0.6 | 6 | 400 | 67 | 0 |
| 32 | MeOCH2CH2 | 72 | ||||
| 33 | MeCH2OCH2 | 20 | 11 | >10000 | >1000 | |
| 34 | MeSO2CH2CH2 | 3200 | ||||
| 35 | t-BuCH2 | 0.14 | 2 | 5000 | >2500 | |
| 36 |

|
200 | ||||
| 37 |

|
410 | ||||
| 38 |

|
2 | 2 | 530 | 265 | |
| 39 |

|
1800 | ||||
| 40 |

|
6 | 5 | 610 | 122 | 0 |
| 41 | c-PenCH2 | 0.1 | 0.4 | >10000 | >25000 | |
| 42 |

|
19 | 8 | 3000 | 375 | |
| 43 |

|
36 | ||||
| 44 |

|
34 | 21 | 5000 | 238 | 5 |
| 45 |

|
370 | ||||
| 46 |

|
740 | ||||
| 47 | Ph(Me)CH | 1.5 | 3 | 560 | 190 | |
Displacement was measured using [3H]CP55940 in CHO cell membrane preparations overexpressing hCB1 or hCB2 receptors.
% transported from the apical side (A) to the basal side (B).
