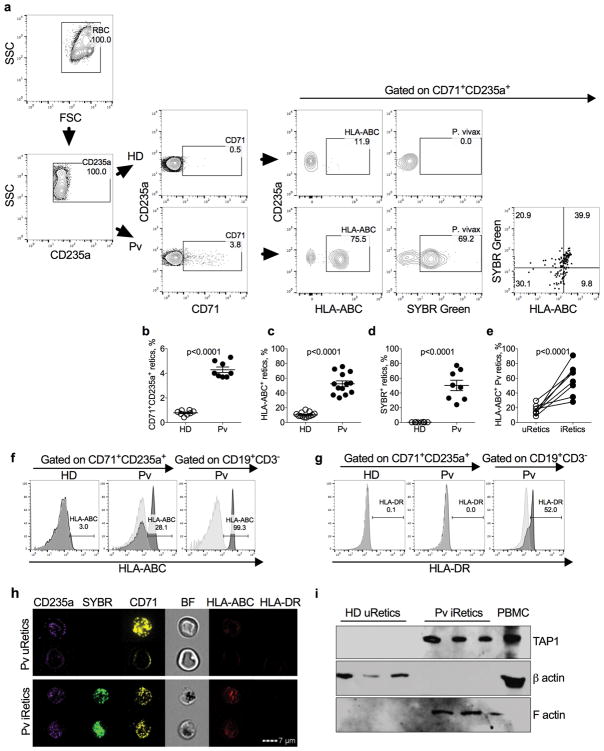
Figure 2. Increased HLA-ABC in P. vivax infected reticulocytes.
a, Gating strategy to evaluate P. vivax infection and HLA-expression in reticulocytes. Top and bottom panels are representative results from a healthy donor (HD) and P. vivax acute malaria patient (Pv) before treatment (BT), respectively. Retics are CD71+CD235a+ and SYBR Green detects parasite DNA in iRetics. A pan-HLA class I antibody was used to analyze HLA expression. This experiment was repeated four times with similar results. b–d, Comparison of percent of retics in RBC gate (b), percent of Retics that express HLA-I, (c) percent of SYBR Green+ iRetics (d) in blood from HD (n=8) and Pv BT patients (n=8). Shown are mean ± SEM; statistical analysis by two-tailed non-parametric unpaired t-test at 95% CI. e, Comparison of HLA-ABC expression in circulating uRetics and iRetics in n=8 Pv BT samples, based on SYBR Green I and HLA staining of CD235a+CD71+ Retics, representative dot plot in (a). Shown are mean ± SEM; statistical analysis used a two-tailed parametric paired t-test at 95% CI. f,g, Comparison of HLA-ABC (f) and HLA-DR (g) expression by HD uRetics and Pv iRetics and CD19+ B cells. Light gray histograms are unstained and darker gray histograms are stained cells. Shown are representative samples of 5 analyzed. h, Imaging flow cytometry of representative Pv uRetics (top) and iRetics (bottom) stained for CD235a, SYBR Green, CD71, HLA-ABC and HLA-DR. This experiment was repeated three times with similar results. i, Immunoblot of cell lysates from 3 HD uRetics and 3 Pv iRetics, loaded with 50 μg of protein per well and probed for the antigen processing protein, TAP1 as well as β-actin and F-actin as loading controls for HD uRetics and Pv BT iRetics, respectively. HD PBMCs were used as a positive control (20 μg). This experiment was repeated three times with similar results.

