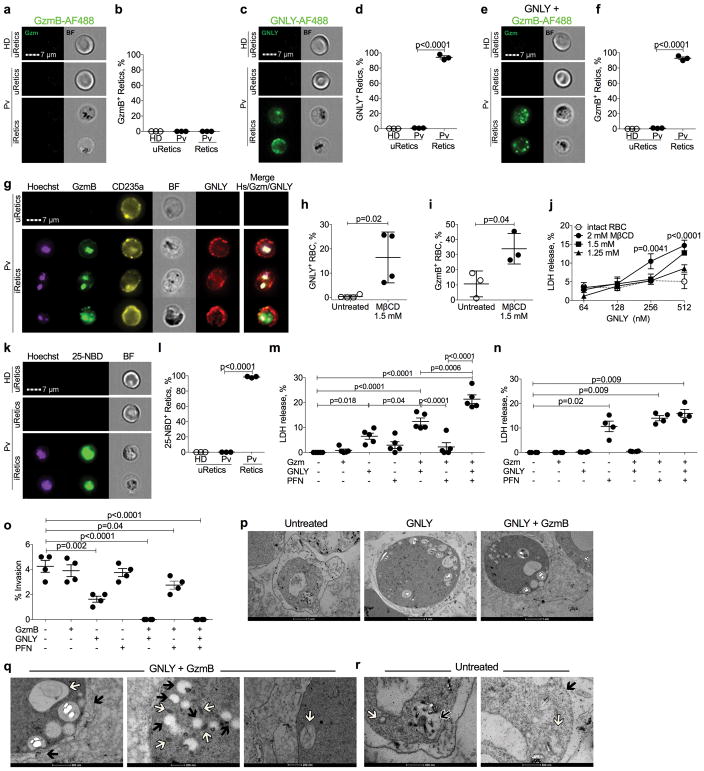
Figure 4. Granulysin binds to infected reticulocytes and mediates host cell lysis and parasite killing.
a–f, Imaging flow cytometry analysis of uptake of GzmB-AF488
(a,b) or GNLY-AF488 (c,d) on their own, or of
GzmB-AF488 in the presence of unlabeled GNLY (e,f) by healthy donor
(HD) unifected Retics (uRetics) and by uRetics and infected retics (iRetics)
from acute untreated P. vivax patients (Pv).
(a,c,e) show representative images, while (b,d,f)
show mean ± SEM of 3 HD and Pv samples. g, Imaging flow
cytometry images of Pv uRetic and iRetics incubated with GzmB-AF488 and
GNLY-AF750, and stained for CD235a and with a Hoechst dye to stain parasite DNA.
BF, bright field. This experiment was repeated three times with similar results.
h–j, Effect of mβCD depletion of cholesterol in
HD RBCs on binding of GNLY-AF488 on its own (n=4). Shown p values are in
comparison to intact RBC. (h) and of GzmB-AF488 in the presence of
unlabeled GNLY (n=3) (i); and on RBC lysis by increasing
amounts of GNLY, assessed by LHD release (n=4). k,l,
Staining of HD uRetics and of untreated Pv patient uRetics and iRetics with the
cholesterol analog 25-NBD (n=3). Representative images are shown in
(k) (n=5) and the proportion of cells with detectable
25-NBD fluorescence is shown in (l) (n=4).
m,n, Cytolysis of Pv iRetics (m, n=5) or
HD uRetics (n, n=4) after 1 hr incubation with GzmB
± GNLY ± PFN, assessed by LDH release. o, Effect of
incubation of iRetics from 4 Pv patients for 1 hr with indicated cytotoxic
granule proteins on parasite invasion of fresh Retics, assessed by Giemsa
staining. p–r, Electron micrographs of iRetics that were
untreated or incubated with GNLY ± GzmB. Higher magnification images
after treatment with GNLY plus GzmB in (q) show parasitophorous
vacuole membrane disruption (  ) and
chromatin condensation (
  ) (left);
cytoplasmic vacuolization (
  ) and
dense granules (
  ) (middle); and
mitochondrial swelling (
  ) (right).
Higher magnification images of untreated cells (r) show intact
digestive vacuole (
  ),
parasitophorous vacuole membrane (
  ) and mitochondria (
  ). These
experiments were repeated three times with similar results (p,r). Graphs show
mean ± SEM; statistics in (b,d,f,j,l–o) were
analyzed by one-way ANOVA and in (h,i) by two-tailed non-parametric
paired t-test at 95% CI.

