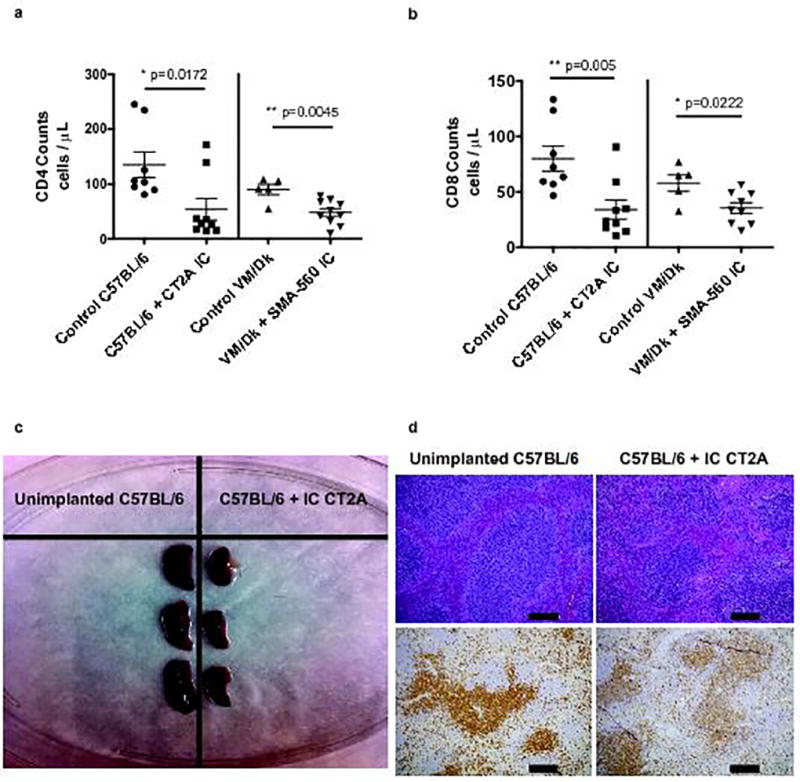
Fig. 2. Recapitulated T-cell lymphopenia and lymphoid organ contraction in murine glioma.

a, Blood CD4 T-cell counts in n=8 control C57BL/6 and n=5 control VM/Dk mice, or n=9 IC CT2A glioma-bearing C57BL/6 mice and n=10 SMA-560 glioma-bearing VM/Dk mice. b, Blood CD8 T-cell counts in n=8 control C57BL/6 and n=5 control VM/Dk mice, or n=9 intracranial (IC) CT2A glioma-bearing C57BL/6 mice and n=9 SMA-560 glioma-bearing VM/Dk mice. Data in a–b are shown as mean ± s.e.m. P values were determined by two-tailed, unpaired Student’s t-test. c, Gross image depicting spleens taken from unimplanted or IC CT2A glioma-bearing C57BL/6 mice. d, Hematoxylin & eosin (H&E) staining (upper panel) or immuno-histochemistry (IHC) for CD3 (lower panel) of formalin-fixed paraffin-embedded (FFPE) spleen taken from unimplanted or IC CT2A glioma-bearing C57BL/6 mice. Histopathologic examination of spleens from IC CT2A mice showed diminution in T-dependent lymphoid areas. These findings accompanied marked organ lymphopenia and lymphoid necrosis. IHC confirmed spleens of IC CT2A mice had marked T-cell lymphopenia, scale bar = 200 µm. All data in a–d are representative findings from one of at least three independently repeated experiments with similar results. Blood (a–b) was drawn and spleens (c–d) were harvested at 18 days following tumor implantation.
