
Fig. 3. Naïve T-cells accumulate in the bone marrow of mice and patients with GBM.
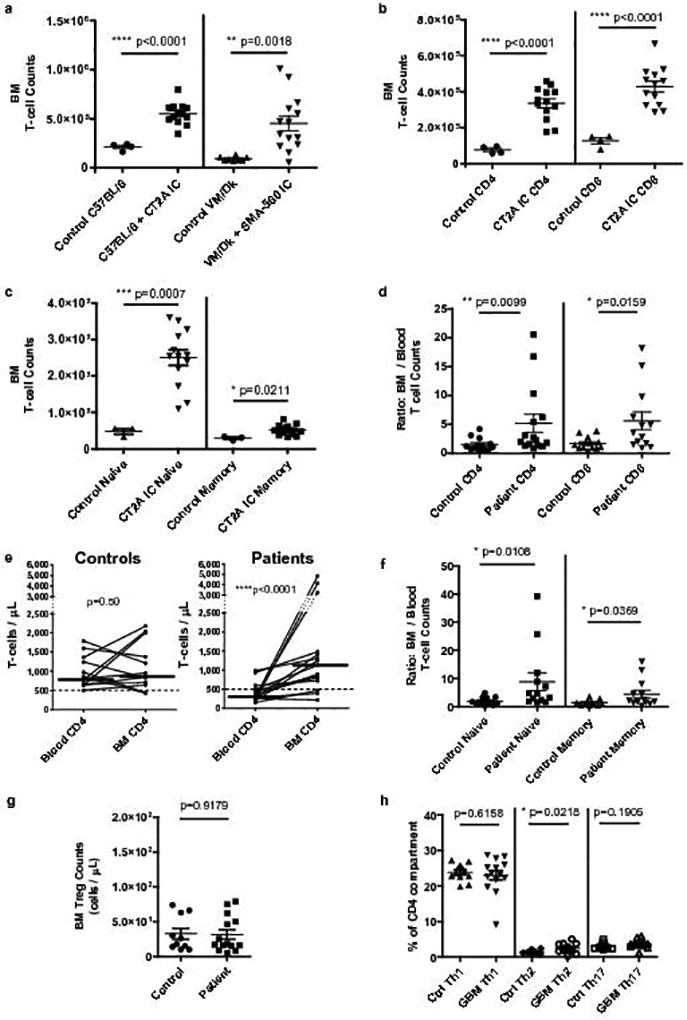
a, Bone marrow T-cell counts from a single hind leg femur and tibia in n=4 control C57BL/6 and n=8 control VM/Dk mice, or n=13 IC CT2A glioma-bearing C57BL/6 mice and n=14 SMA-560 glioma-bearing VM/Dk mice. b, Bone marrow CD4+ and CD8+ T-cell counts in n=4 control C57BL/6 or n=13 IC CT2A mice. c, Bone marrow naïve and memory CD4+ T-cell counts in n=3 control C57BL/6 or n=13 IC CT2A mice. Cumulative data from three experiments are depicted in a–c. d, The ratio of bone marrow to blood CD4 and CD8 counts were calculated for n=15 treatment-naïve GBM patients and n=13 spinal fusion controls. e, For the same n=13 controls and n=15 GBM patients, paired absolute CD4+ T-cell counts in blood and bone marrow are depicted. Median counts in each compartment are identified by horizontal lines. Dashed line demarcates low cut-off of normal CD4 range. Similar results were obtained for CD8+ T-cells. f, For the same n=13 controls and n=15 GBM patients, the ratio of bone marrow to blood naïve and memory T-cells was calculated. g, Regulatory T-cells (Treg) counts in the bone marrow of n=11 controls compared to n=15 GBM patients. h, Relative frequencies of CD4+ T-helper cell subsets: Th1 (CXCR3+CCR6−), Th2 (CXCR3−CCR6−), Th17 (CXCR3−CCR6+) in bone marrow of n=13 controls and n=15 GBM patients. Data in a–d, f–h are shown as mean ± s.e.m. P values were determined by two-tailed, unpaired Student’s t-test (a–c,g–h) and two-tailed, Mann Whitney test with Gaussian approximation (d, f). Blood and bone marrow CD4+ T-cell counts in e were compared using Wilcoxon matched-pairs signed rank tests, P values are depicted.