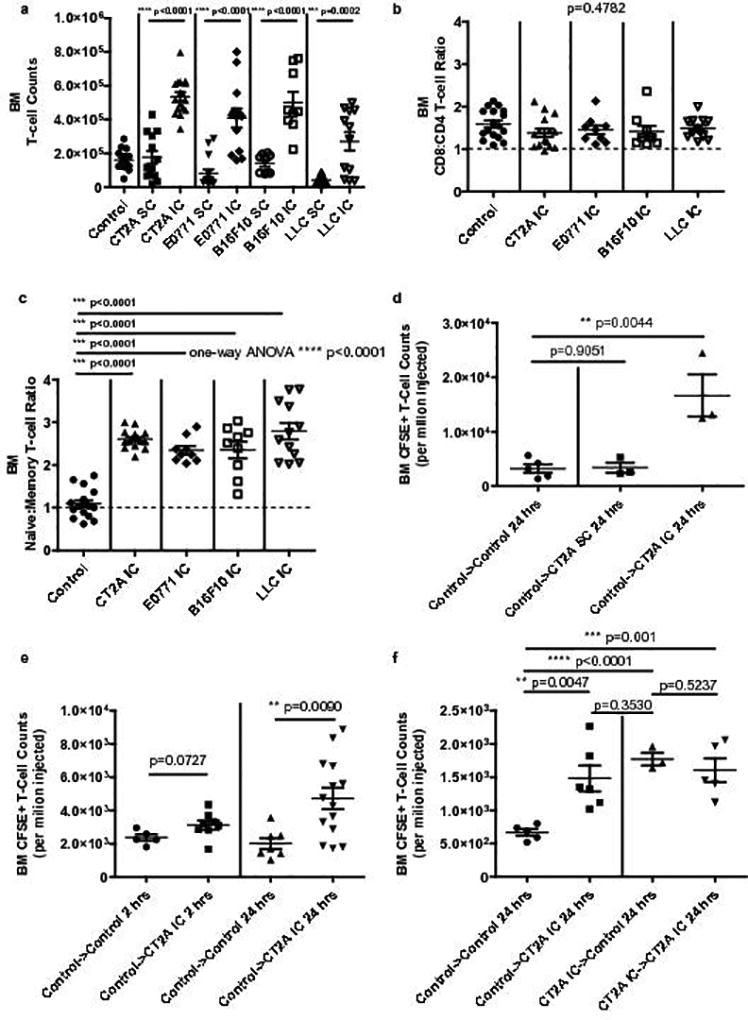
Fig. 4. T-cell accumulation in bone marrow reflects intracranial tumor location rather than tumor histologic type.

a, Bone marrow T-cell counts in n=13 SC and n=17 IC CT2A glioma-bearing C57BL/6 mice, or n=15 SC and n=13 IC E0771 breast carcinoma-bearing mice, or n=9 SC and n=9 IC B16F10 melanoma-bearing mice, or n=13 SC and n=12 IC Lewis Lung carcinomas (LLC)-bearing mice. b, CD8:CD4 ratios in the bone marrow of n=15 IC CT2A, n=9 IC E0771, n=9 IC B16F10, or n=12 IC LLC-bearing mice. c, Naïve:Memory T-cells ratios in the bone marrow of the same tumor-bearing mice as in b. Counts and ratios in a–c were compared to those in the bone marrow of n=17 control C57BL/6 mice. Data in a–c are cumulative results from a minimum of two experiments with each tumor type. d, Accumulation of adoptively transferred CFSE-labeled T-cells in the bone marrow of n=5 recipient control C57BL/6 or CT2A glioma-bearing C57BL/6 mice. Glioma bearing mice harbored tumor in either the IC or SC compartment (n=3 tumor-bearing mice per group). T-cell counts were assessed 24 hours following adoptive transfer. Transferred cells were splenocytes from naïve C57BL/6 (control) donors. e. Accumulation of adoptively transferred CFSE-labeled T-cells in the bone marrow of n=5 control recipient mice and n= 8 IC CT2A-bearing (CT2A IC) recipient mice at 2 hours (left) post-transfer, or n=7 control recipient mice and n=14 IC CT2A-bearing (CT2A IC) recipient mice at 24 hours (right) post-transfer. Transferred cells were splenocytes from naïve C57BL/6 (control) donors. f. Accumulation of adoptively transferred CFSE-labeled T-cells in the bone marrow of n=5 control recipient mice and n=6 CT2A IC recipient mice 24 hours after transfer (left). Transferred cells were splenocytes from naïve C57BL/6 (control) donors. Accumulation of adoptively transferred CFSE-labeled T-cells in the bone marrow of n=3 control recipient mice and n=5 CT2A IC recipient mice 24 hours after transfer (right). Transferred cells were bone marrow cells from CT2A IC mice. Data in d–f are representative findings from one of a minimum of two independently repeated experiments with similar results. All data in a–f are shown as mean ± s.e.m. P values in a, d–f were determined by two-tailed, unpaired Student’s t-test. Ratios in b, c were compared using one-way ANOVA, with post hoc Tukey’s test when applicable. P values are depicted.
