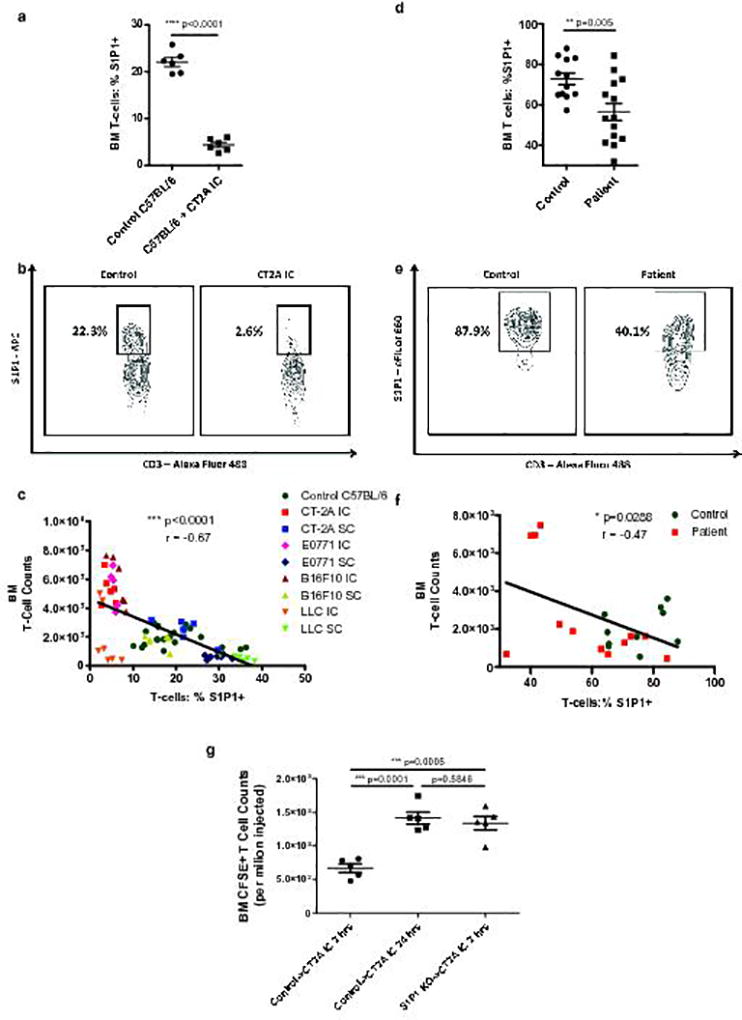
Fig. 5. Loss of surface S1P1 on T-cells directs their sequestration in bone marrow in the setting of intracranial tumor.

a, The percentage of nascent T-cells expressing surface S1P1 was assessed by flow cytometry in the bone marrow of n=6 control C57BL/6 mice or n=6 mice bearing IC CT2A on Day 18 following tumor implantation. b, Representative flow cytometry plot of data depicted in a. c, Negative correlation between bone marrow T-cell counts and S1P1 levels on bone marrow T-cells across IC and SC murine tumor models. Data in c were obtained from n=6 IC CT2A, n=5 IC E0771, n=6 IC B16F10, n=7 IC LLC, n=6 SC CT2A, n=7 SC E0771, n=6 SC B16F10, and n=7 SC LLC tumor-bearing mice. N=21 control C57BL/6 were also included. Data in c are cumulative results from a minimum of two experiments with each tumor type. d, The percentage of nascent T-cells expressing surface S1P1 was assessed by flow cytometry in the bone marrow of n=14 GBM patients or n=12 age-matched controls. e, Representative flow cytometry plot of data depicted in d. f, Negative correlation between bone marrow T-cell counts and surface S1P1 levels on bone marrow T-cells in n=12 GBM patients and n=10 age-matched controls. g, Relative sequestration of adoptively transferred CFSE-labeled T-cells within the bone marrow of IC CT2A recipient mice either 2 or 24 hours after transfer (n=5 mice per group). As indicated, transferred cells were splenocytes from either control C57BL/6 donors (control) or from S1P1 conditional knockout (S1P1 KO) donors. Data in g are representative findings from one of a minimum of two independently repeated experiments with similar results. All data in a, d, and g are shown as mean ± s.e.m. P values in a, d, and g were determined by two-tailed, unpaired Student’s t-test. Two-tailed, p values and Pearson coefficients for c, f are depicted.
