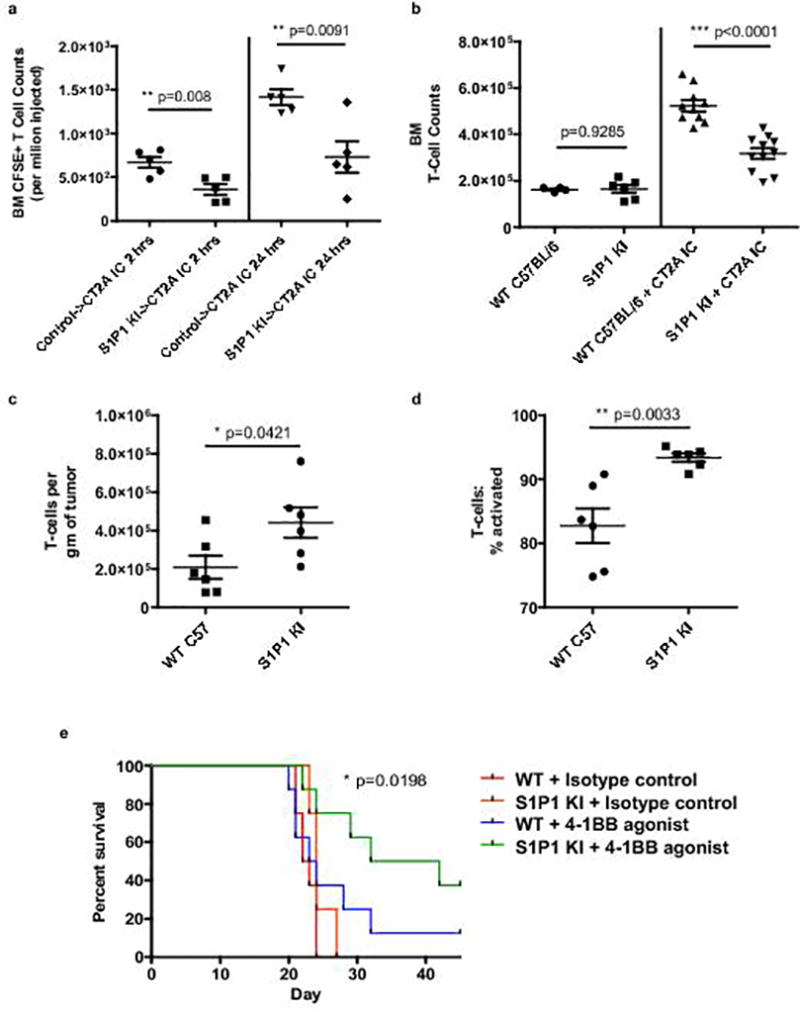
Fig. 6. Hindering S1P1 internalization abrogates T-cell sequestration in bone marrow.

a, Relative sequestration of adoptively transferred CFSE-labeled T-cells within the bone marrow of CT2A IC recipient mice at 2 hours (left) or 24 hours (right) after transfer. As indicated, transferred cells were splenocytes from either control C57BL/6 donors (control) or from S1P1 stabilized “knock-in” (S1P1 KI) donors (n=5 recipient mice per group). Data in a are representative findings from one of a minimum of two independently repeated experiments with similar results. b, T-cell counts in the bone marrow of n=10 IC CT2A-bearing wild type (WT) C57BL/6 or n=11 S1P1 KI mice. Counts were assessed 18 days following tumor implantation and are shown relative to baseline counts in n=6 tumor-naïve control WT or n=6 tumor-naïve S1P1 KI mice. Cumulative data from three experiments are depicted in b. c, IC CT2A tumors were harvested from n=6 WT C57BL/6 (WT) or n=6 S1P1 KI mice 18 days following tumor implantation. TIL were assessed by flow cytometry and the number of total T-cells per gram of tumor quantified. d, The frequency of activated effector (CD44hiCD62Llo) T-cells in IC CT2A tumors from the same n=6 WT C57BL/6 (WT) or n=6 S1P1 KI mice in c was also quantified. Data in c, d are representative findings from one of a minimum of three independently repeated experiments with similar results. e, C57BL/6 (WT) or S1P1 KI mice were implanted with IC CT2A tumors and treated with a 4-1BB agonist antibody or isotype control (n=8 per group). All data in a–d are shown as mean ± s.e.m. P values in a–d were determined by two-tailed, unpaired Student’s t-test. Survival in e was assessed by two-tailed generalized Wilcoxon test. P value for overall comparison is depicted.
