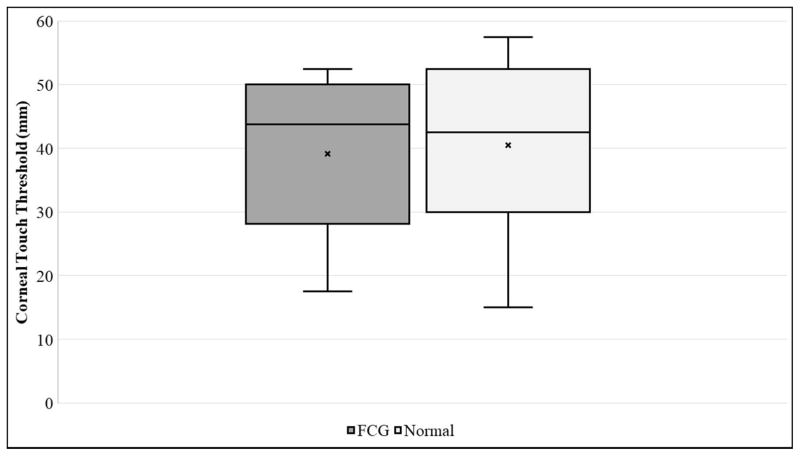
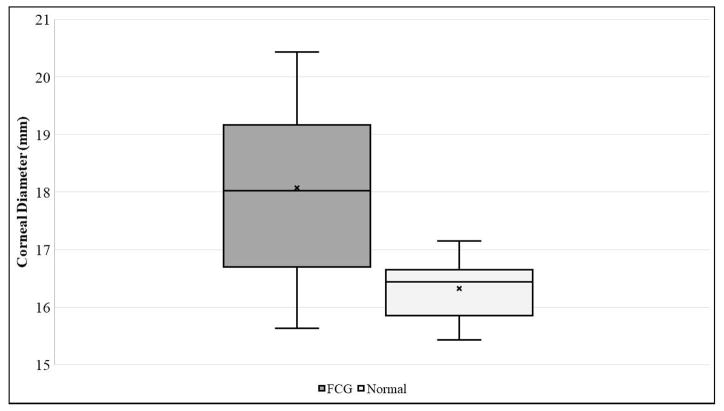
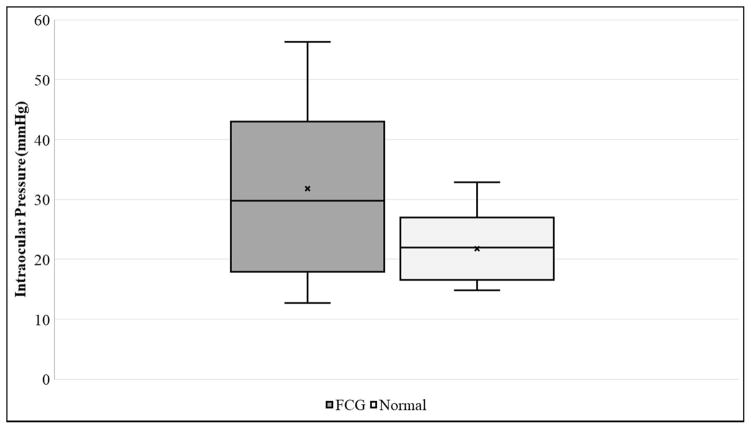
Figure 1A–C.
Box and whisker plots depicting [A] Corneal Touch Threshold (CTT), [B] Corneal Diameter (CD), and [C] Intraocular Pressure (IOP) for FCG and normal cats. In each plot “x” represents the mean, the median is depicted by a horizontal line dividing the box, which represents the interquartile range, and the whiskers show the outlier range outside of the upper and lower quartiles (includes lowest and highest data points).


