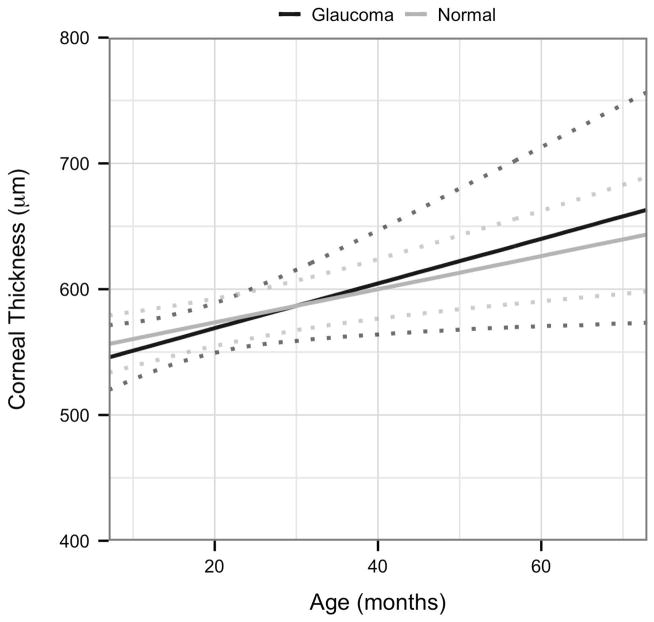
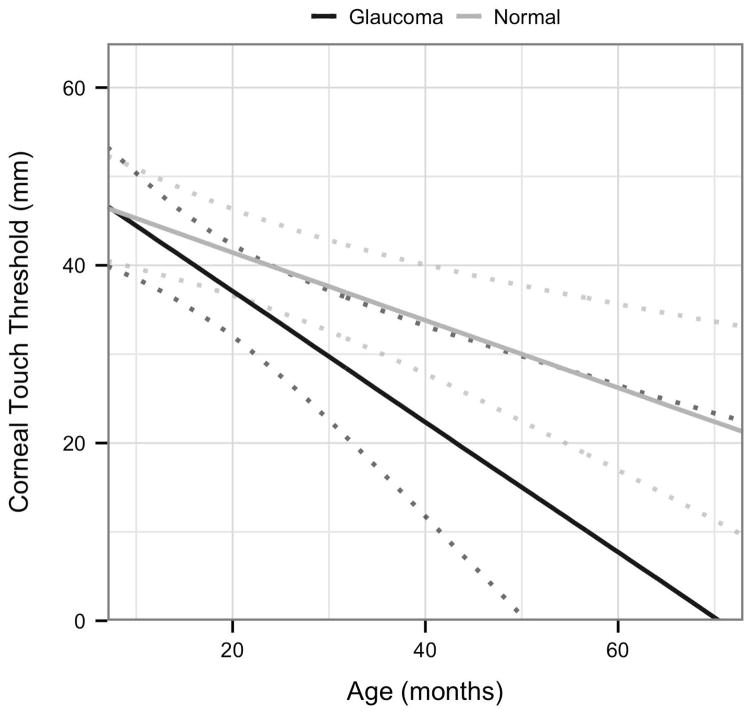
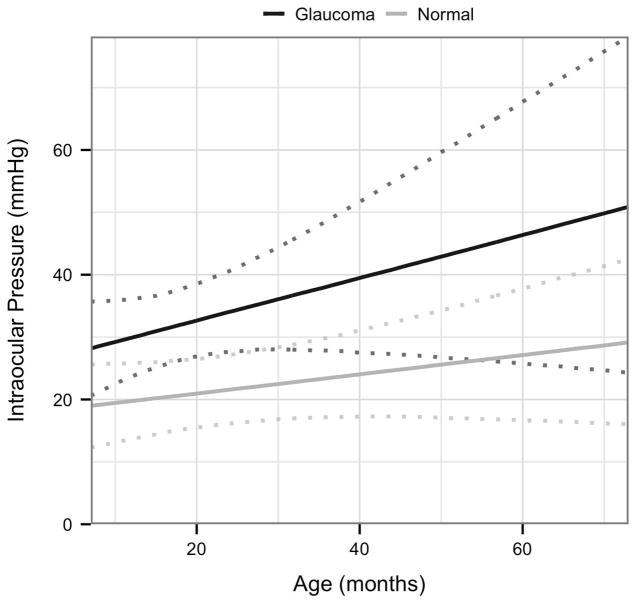
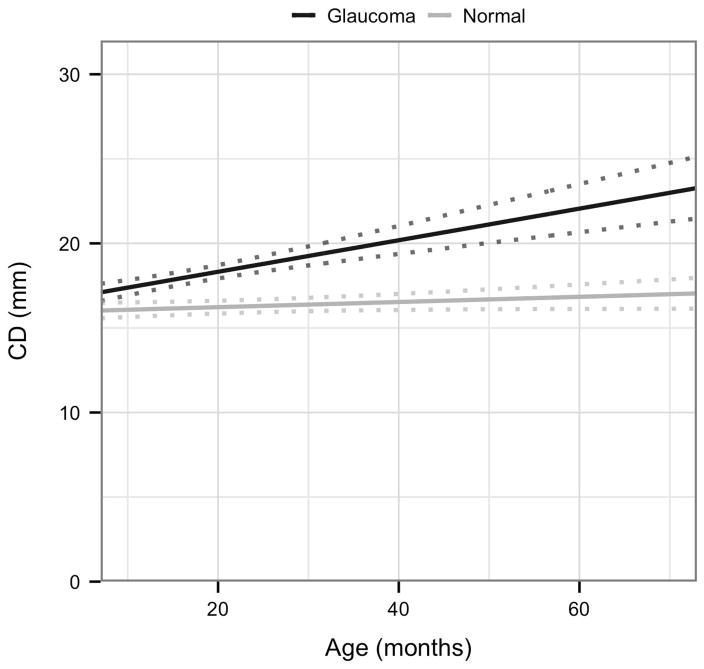
Figure 3A–D.
Visualization of the linear mixed effects model fitting:[A] central corneal thickness as a response to age and disease status; [B] corneal touch threshold as a response to age and disease status; [C] intraocular pressure as a response to age and disease status, and [D] corneal diameter as a response to age and disease status; each plot indicates 95% confidence intervals.


