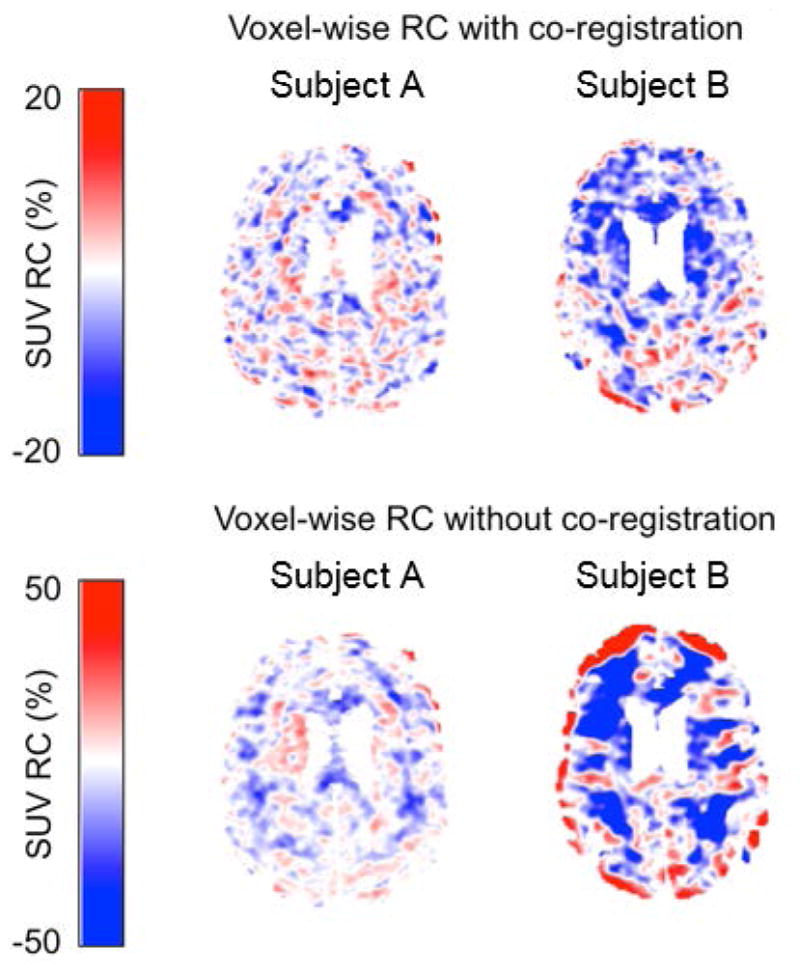
Fig. 4.

Maps of SUV RCvox values of the 2 representative subjects shown in Figure 2A. The top and bottom panels show the SUV RCvox values with and without co-registration of PETNoMC respectively. The subject with more motion (subject 2) showed greater RC after MC was applied
