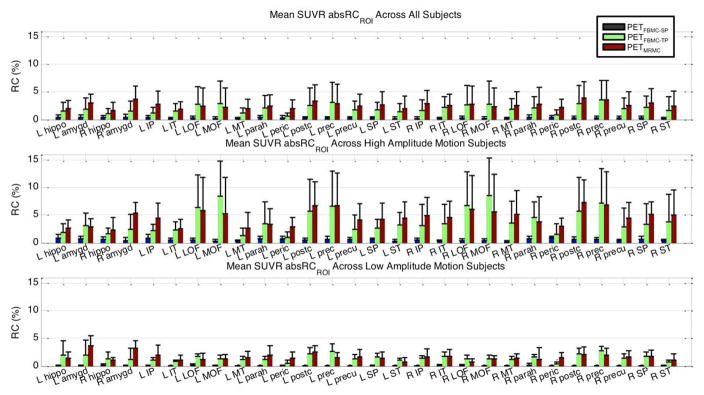
Fig. 6.
The mean and SD of SUVR absRCROI values, comparing the PET volumes processed with single-pass FBMC (blue), two-pass FBMC (green), or MRMC (red) to the PET volumes without MC, in selected ROIs across all 30 subjects (top), the quintile of subjects with the most motion (middle), and the quintile of subjects with the least motion (bottom). Abbreviations are same as those in Figure 5

