

Abstract
Visual information processed in the retina is transmitted to primary visual cortex via relay cells in the lateral geniculate nucleus (LGN) of the dorsal thalamus. Although retinal ganglion cells are the primary source of driving input to LGN neurons, not all retinal spikes are transmitted to the cortex. Here, we investigate the relationship between stimulus contrast and retinogeniculate communication and test the hypothesis that both the time course and strength of retinogeniculate interactions are dynamic and dependent on stimulus contrast. By simultaneously recording the spiking activity of synaptically connected retinal ganglion cells and LGN neurons in the cat, we show that the temporal window for retinogeniculate integration and the effectiveness of individual retinal spikes are inversely proportional to stimulus contrast. This finding provides a mechanistic understanding for the phenomenon of augmented contrast gain control in the LGN—a non-linear receptive field property of LGN neurons whereby response gain during low-contrast stimulation is enhanced relative to response gain during high-contrast stimulation. In addition, these results support the view that network interactions beyond the retina play an essential role in transforming visual signals en route from retina to cortex.
Keywords: LGN, retina, thalamus, vision, cat
Graphical Abstract
By simultaneously recording the spiking activity of synaptically connected retinal ganglion cells and LGN neurons in vivo, this study investigates the relationship between stimulus contrast and the dynamics of retinogeniculate communication. Results reveal that the temporal window for retinogeniculate integration and the effectiveness of individual retinal spikes are inversely proportional to stimulus contrast, providing a mechanistic understanding for the phenomenon of augmented contrast gain control in the LGN.
Introduction
At the heart of the retinogeniculocortical pathway are relay cells in the lateral geniculate nucleus (LGN) of the dorsal thalamus. LGN relay cells receive monosynaptic input from retinal ganglion cells (RGCs) and send axons to target neurons in primary visual cortex. Although the retina supplies only 5–10% of all geniculate synapses (Hamos et al., 1987), the retina is considered the driver of LGN responses (reviewed in Sherman & Guillery, 2013; also see Kaplan & Shapley, 1984; Sincich et al., 2007). Consequently, the center/surround receptive fields of LGN cells closely match those of their retinal inputs (Usrey et al., 1999).
Although the retina is the driver of geniculate activity, not all retinal spikes evoke LGN responses. Results from several studies show that the probability of successful retinogeniculate communication depends on the recent spiking history of RGCs. In particular, retinal spikes are most effective in driving LGN spikes when they are preceded by short interspike intervals (ISIs) (Mastronarde, 1987; Usrey et al., 1999; Levine & Cleland, 2001; Sincich et al., 2007; Weyand, 2007; Rathbun et al., 2010). This activity-dependent process has been successfully described by standard linear-nonlinear models with two basic assumptions: (1) the gain and time constant of retinal integration in the LGN is constant and (2) LGN spiking can be accurately modeled simply by considering the timing of retinal input (Carandini et al., 2007; Casti et al, 2008).
Despite the strength of current models of retinogeniculate transmission, static temporal summation represents a starting point from which one can consider how changes in the behavioral context and/or spatial environment may influence thalamic processing. Because geniculate cells receive 90–95% of their synapses from nonretinal sources (Guillery, 1969; Erisir et al., 1997), such as primary visual cortex, the thalamic reticular nucleus (TRN), and the cholinergic arousal system of the brainstem, it seems likely that retinogeniculate communication is dynamic rather than static depending on non-retinal network interactions (reviewed in Sherman & Guillery, 2013).
One way in which nonretinal inputs are thought to modulate retinogeniculate communication and visual processing in the LGN is evident with contrast gain control, a suite of interrelated phenomena whereby the gain and temporal response properties of visual neurons are dynamically regulated by stimulus contrast (Shapley & Victor, 1978). With contrast gain control, response gain decreases in amplitude and temporal dynamics quicken as stimulus contrast increases. This leads to several well-defined, contrast-dependent response properties, including saturating contrast response functions and rightward shifts in temporal frequency tuning curves (Shapley & Victor, 1978, 1980; Benardete et al., 1992; Usrey & Reid, 2000; Alitto & Usrey, 2004; Mange et al., 2008; Rathbun et al., 2016). Although past studies have shown that contrast affects the percentage of retinal spikes that evoke LGN responses (Kaplan et al., 1987; Cheng et al., 1995) and contrast gain control is augmented in the LGN relative to the retina (Kaplan et al., 1987; Scholl et al, 2012; Rathbun et al., 2016; but see Sclar, 1987), our understanding of how contrast influences the integration of retinogeniculate EPSPs to drive LGN responses is unknown.
To examine the relationship between contrast gain control and the temporal integration of retinal inputs to LGN neurons, we made simultaneous recordings from monosynaptically connected RGCs and LGN neurons in the anesthetized cat. Our results show that while the percentage of LGN spikes evoked from the retina increases with increasing contrast, the gain and time constant for retinogeniculate communication decreases with increasing contrast, consistent with the augmentation of contrast gain control in the LGN (Kaplan et al., 1987; Scholl et al., 2012; Rathbun et al., 2016; but see Sclar, 1987). Taken together, these results demonstrate that retinogeniculate communication is a dynamic process, dependent on stimulus statistics and features in the visual environment.
Materials and Methods
Eight adult cats were used for this study. Some of the data examined in this study contributed an earlier study quantifying the magnitude of contrast gain control in the retina and LGN (Rathbun et al., 2016).
Animal preparation
All surgical and experimental procedures conformed to NIH guidelines and were carried out with the approval of the Animal Care and Use Committee at the University of California, Davis. Surgical anesthesia was induced with ketamine (10 mg/kg, IM) and maintained with thiopental sodium (20 mg/kg, IV, supplemented as needed). A tracheotomy was performed and animals were placed in a stereotaxic apparatus. Temperature, EKG, EEG, and expired CO2 were continuously monitored for the duration of the experiment. Anesthesia was maintained by a continuous infusion of thiopental sodium (2–3 mg/kg/hr, IV). If physiological monitoring indicated a decrease in the level of anesthesia, supplemental thiopental was given and the rate of infusion was increased. All wound margins were infused with lidocaine. A craniotomy was made above the LGN and the dura was reflected. The underlying brain was protected with a layer of agarose. The eyes were secured to posts mounted on the stereotaxic frame, fitted with appropriate contact lenses, and focused on a tangent screen located 172 cm in front of the animal. The nictitating membranes were retracted with 10% phenylephrine and flurbiprofen sodium drops were administered (1.5 mg/hr) to prevent miosis. The positions of area centralis and the optic disk were mapped by back-projecting the retinal vasculature of each eye onto a tangent screen. Once all surgical procedures were complete, animals were paralyzed with vecuronium bromide (0.2 mg/Kg/hr, IV) and mechanically respired. At the conclusion of each experiment, the animal was euthanized with Euthasol (100 mg/kg; Virbac Animal Health, Fort Worth, Texas).
Electrophysiological recording and visual stimuli
Recordings were made from neurons in layers A and A1 of the LGN and the ganglion cell layer of the retina. For LGN recordings, the LGN was first located using single, parylene-coated tungsten electrodes (AM Systems, Everett, WA). Once the appropriate retinotopic position in the LGN was determined, a multielectrode array containing 7 independently moveable platinum-in-quartz electrodes (Thomas Recording, Marburg, Germany) was inserted. Retinal ganglion cells were recorded from using a tungsten microelectrode that was inserted into the eye through an intraocular guided tube and maneuvered via a custom-made manipulator. Neural responses were amplified, filtered and recorded to a computer equipped with a Power 1401 data acquisition interface and the Spike 2 software package (Cambridge Electronic Design, Cambridge, UK). Spike isolation was based upon waveform analysis (parameters established independently for each cell) and the presence of a refractory period as indicated in the autocorrelogram.
Visual stimuli were generated using a VSG2/5 visual stimulus generator (Cambridge Research Systems, Rochester, England) and presented on a gamma-calibrated Sony monitor running at 140Hz. The mean luminance of the monitor was 38 candelas/m2. Neurons were excited with drifting sine-wave gratings (4 Hz, 0.1–100% contrast, preferred spatial frequency).
Cross-correlation analysis
To assess connectivity between pairs of RGCs and LGN neurons, cross-correlograms between retinal and geniculate spike trains were calculated by generating a histogram of retinal spikes relative to each LGN action potential. Shuffle correlograms were computed by shifting retinal spikes times by one stimulus cycle (typically 250 ms) and recreating the histograms. Peaks indicative of monosynaptic connectivity were narrow (< 1.5 ms, full width at half height), short-latency (< 7 ms), and exceeded 5× the standard deviation of the baseline (Cleland et al., 1971; Usrey et al. 1998). For quantitative analysis, bins contributing to the peak were identified using a bin size of 0.5 ms. The peak bin was first identified and all neighboring bins greater than 3 standard deviations above the baseline mean were considered part of the peak; where the baseline consisted of bins ranging from 30 to 50 ms on either side of the peak bin.
Retinal spike contribution and efficacy
The monosynaptic peak was used to calculate two measures of correlation strength, efficacy and contribution. Efficacy is the number of events in the monosynaptic peak relative to the total number of retinal spikes, whereas contribution is the number of events in the peak relative to the total number of LGN spikes. To the extent that peaks were caused by monosynaptic connections, efficacy and contribution have very simple interpretations, where efficacy represents the fraction of spikes from the recorded RGC that caused the simultaneously recorded geniculate cell to fire, and contribution represents the fraction of geniculate cell spikes that were caused by spikes from the simultaneously recorded RGC. Although LGN neurons in the cat receive retinal input from ~1–5 RGCs (Mastronarde, 1987; Reid and Usrey, 2004), our analysis did not take convergence into account. Given that retinal spike efficacy and contribution are binomial variables, chi square tests were used to determine significant differences.
Contrast-invariant model of retinal spike efficacy
To determine the influence of contrast on retinal spike efficacy we generated a contrast-invariant model of retinogeniculate transmission. For each recorded cell pair, we first calculated the average spike efficacy across a range of interspike intervals (ISIs) during visual stimulation with a 100% contrast, drifting sine-wave grating (4 Hz). We then modeled the average spike efficacy at all contrasts by assigning each retinal spike the efficacy value calculated for the relevant ISI at 100% contrast. Thus, the spike efficacy at each contrast became the value expected if retinogeniculate transmission did not systematically vary with stimulus contrast (100% contrast remains unchanged).
Statistical analysis
When statistical analysis was required to compare two distributions, we first tested the normality of the distributions using Lilliefors modification of the Kolmogorov-Smirnov test. If it was determined that both distributions were not significantly different from normal distributions, then a t-test was used to compare the means of the two samples, otherwise a Wilcoxon rank sum test or a sign test was used. Chi-square tests were used to compare binomial variables, such as retinal spike efficacy and contribution. Where appropriate, statistical tests were Bonferroni corrected for multiple comparisons. X and Y cells were classified based on the latency of the monosynaptic peak (Usrey et al., 1999). Using this measure, of the 14 cell pairs examined in this study, 4 were X cell pairs and 10 were Y cell pairs. Results did not differ for these cell groups; thus the 14 cell pairs were treated as a single group for the statistical analyses presented. It should be noted that small differences between X and Y cells may have gone undetected because of the small sample sizes inherent to studying monosynaptic connections in vivo.
Results
To determine the influence of stimulus contrast on retinogeniculate communication, we recorded the spiking activity of 14 pairs of synaptically connected RGCs and LGN neurons in the anesthetized cat across a full-range of stimulus contrasts. Contrast response functions were made from the responses of cells to drifting sine-wave gratings (preferred spatial frequency, 4Hz) that varied in contrast, and connectivity was assessed using cross-correlation analysis (Figure 1; see Materials and Methods). Communication strength was quantified using two well-defined values—retinal contribution and efficacy (Levick et al. 1972)—where contribution is the percentage of LGN cell spikes evoked from a RGC, and efficacy is the percentage of RGC spikes that evoked LGN cell spikes (see Materials and Methods).
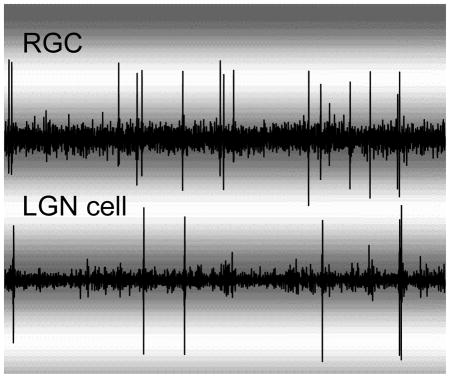
Figure 1.

Relative activity patterns between a representative RGC and LGN neuron. A. Simultaneously recorded voltage traces from a RGC and LGN neuron. B. Raster plot showing the occurrence of RGC spikes (black dots) relative to 400 consecutive LGN cell spikes. LGN spikes centered at time zero. C. Cross correlogram showing the relative activity between the RGC and LGN cell. LGN cell spikes are centered at time zero. The sharp peak to the left of zero shows that the RGC often produced a spike ~3 ms before the LGN cell. Correlation strength indicates the probability that a RGC spike occurred during a particular time bin relative to an LGN cell spike.
Retinal contribution and stimulus contrast
Before examining the contribution and efficacy of retinal spikes, contrast response functions were generated for each cell. Contrast response functions from 3 representative LGN cells are shown in Figure 2 (column A). In each example, response gain (change in firing rate/change in stimulus contrast) is high at low contrasts and decreases as contrast increases, a phenomenon known as contrast gain control. Next, we assessed the influence of stimulus contrast on the contribution of retinal spikes to LGN responses. As shown in the cross correlograms in Figure 2 (column B), correlation values (y axis) for retinal spikes were fairly flat over a wide range of time intervals between retinal and LGN cell spikes, except when the retinal spike occurred just prior to the LGN cell spike (at the monosynaptic latency for retinogeniculate communication). These abrupt peaks in the cross correlograms along with other statistical criteria were taken as evidence of anatomical connectivity (see Materials and Methods). Importantly, the relative height of these peaks varied with contrast (3 contrast conditions shown), indicating that contribution values are not static, but increase with contrast. For the 3 representative cells pairs illustrated in Figure 2 (column C) as well as for all cell pairs (Figure 3), contribution values increased rapidly at low contrasts and saturated at higher contrasts. Over the entire sample, the normalized retinal contribution nearly doubled from 0.56 (contrast < 6%, n = 160,163 spikes) to 1.1 (100% contrast, n = 222,010 spikes, p< 10−5). As described in the Discussion, this contrast dependence of retinal contribution has important implications for spike generation and the integration of retinal signals within the LGN.
Figure 2.

Three representative retinogeniculate cell pairs illustrating the relationship between retinal spike contribution and stimulus contrast. A1–A3. LGN contrast response functions. For each example, contrast gain is high at low contrasts and low at high contrasts. B1–B3. retinogeniculate cross-correlograms corresponding to three contrast conditions. In each example, the size of the monosynaptic peak increases with stimulus contrast (green, blue and red traces, respectively). The dashed horizontal lines indicate the correlation strength of the peak for the three different contrast values. Correlation strength indicates the probability that a RGC spike occurred during a particular time bin relative to an LGN cell spike. C1–C3. Line graphs showing the relationship between stimulus contrast and retinal contribution for the three representative cell pairs. Contribution values are low for the lowest contrast conditions and increase rapidly with contrast until a saturation level is reached. Error bars = +/− s.e.m..
Figure 3.

Relationship between stimulus contrast and retinal contribution across the 14 pairs of synaptically connected RGCs and LGN neurons. As with the examples shown in Figure 2, contribution values are lowest with low-contrast stimuli and increase rapidly with increasing contrast. For the population average, there is an indication that contribution values diminish slightly at 100% contrast. Error bars = +/− s.e.m..
Retinal efficacy, stimulus contrast, and contrast gain control
We next examined the relationship between stimulus contrast and the efficacy of retinal spikes to drive LGN responses. Consistent with past studies (Usrey et al., 1998), we found that retinal spike efficacy—the percentage of retinal spikes to evoke LGN spikes—is inversely proportional to the preceding retinal ISI (Figure 4, column A). This manifestation of temporal summation in the LGN predicts that retinal spikes, on average, should be more effective when cells are excited with high-contrast gratings (with higher firing rates and shorter average ISIs) compared to low-contrast gratings. By contrast, the augmentation of contrast gain control in the LGN, suggests the opposite influence of contrast on retinogeniculate communication: individual retinal spikes should become less effective at driving LGN responses as contrast increases and LGN response gain decreases.
Figure 4.

Relationship between retinal interspike interval (ISI) and retinal spike efficacy and the influence of contrast on predicted and observed efficacy values. A1–A4. ISI-efficacy curves for three representative retinogeniculate cell pairs and the population average. Cells were excited with 100% contrast drifting sine-wave gratings. B1–B4. Predicted and observed contrast–efficacy curves for the same three representative cell pairs and the population average. Red traces represent values from the measured (observed) data; blue traces represent contrast-invariant predicted values. The predicted curves were calculated by assigning retinal spikes from different contrast conditions the ISI-efficacy values calculated at 100% contrast (see Materials and Methods). Differences between the two curves show contrast-dependent changes in the influence of ISI on retinal spike efficacy. Error bars = ± s.e.m..
Consistent with contrast-dependent increases in firing rate, retinal spike efficacy values were directly proportional to stimulus contrast for both individual cell pairs as well as for the sample average (Figure 4, row B; red traces). While contrast-dependent firing rate is a fundamental property of neurons in the early visual system, we wished to control for this variable to identify influences of contrast that are not simply a consequence of increased firing rate. Towards this goal, we generated retinal spike efficacy curves using the ISI distributions corresponding to each specific contrast, but associated those ISIs with efficacy values taken from the same ISIs during stimulation with 100% contrast gratings (see Materials and Methods). If ISI-efficacy curves were contrast invariant, then the predicted curves (Figure 4, row B; blue curves) should match the observed curves (Figure 4, row B; red curves). Accordingly, differences between the contrast-invariant prediction and the observed measurements should provide insight into the dynamic nature of retinogeniculate communication.
As illustrated by the three representative cell pairs and the population average in Figure 4, the contrast-invariant prediction underestimated retinal spike efficacy at low contrasts. The differences were significant for all contrasts below 40% contrast (7–10%, p = 0.0244; 11–16%, p = 0.0169; 17–26%, p = 0.0098; 26–40% = 0.0373) and suggest that, at a given ISI, retinal spikes are more effective in driving LGN activity during low-contrast stimulation compared to high-contrast stimulation.
The finding that retinal spikes are more effective at low contrasts than predicted could, in principle, be directly shown by measuring the ISI-efficacy curve at each stimulus contrast. In practice, however, it would be extremely difficult to collect the number of spikes needed for each ISI-contrast combination while maintaining well-isolated, single-unit recordings from synaptically connected cell pairs. To overcome this obstacle, we divided and pooled spikes into two contrast categories (Figure 5, row A): low contrast (<30% of the maximum rate) and high contrast (>70% of the maximum rate). For each example (Figure 5, row B) and the population average (Figure 6A), ISI-efficacy curves are shifted towards higher values for low-contrast data compared to high-contrast data. Overall there was a significant difference between the low- and high-contrast curves (p < 0.0067) and individual ISI categories were significantly different for ISIs between 4 msec and 40 msec (4–11 msec, p = 0.0048; 12–18 msec, p = 0.0386; 19–25 msec, p = 0.0386; 26–32 msec, p = 0.0351). Moreover, there was a small, but significant, increase in the integration window for retinogeniculate transmission during low-contrast visual stimulation (Figure 6B, p < 0.0454), as assessed by the ISI at which the ISI-efficacy curve fell to e−1 of its peak value. Taken together, these results reveal a contrast-dependent modulation of retinogeniculate communication that is consistent with the augmented contrast gain control in the LGN.
Figure 5.

The influence of stimulus contrast on retinal ISI-efficacy curves. A1–A3. Three representative contrast response functions showing how spikes were divided and pooled into low-contrast and high-contrast conditions. As indicated by the dashed lines, low and high contrast were defined as contrasts that evoked less than 30% or greater than 70% of the maximum response, respectively. B1–B3. ISI-efficacy curves for low-contrast (blue curves) and high-contrast (red curves). For each example, retinal spikes were more effective at a given ISI during low-contrast conditions compared to high-contrast conditions. Error bars = ± s.e.m..
Figure 6.

The influence of contrast on retinal spike efficacy and the time constant for LGN integration across the sample of simultaneously recorded pairs of RGCs and LGN neurons. A. Mean ISI-efficacy curves for low-contrast (blue curve) and high contrast (red curve) conditions. Similar to the individual examples shown in Figure 5, retinal spikes were more effective at a given ISI when stimulated with low-contrast gratings compared to high-contrast gratings. Asterisks indicate significant differences in retinal efficacy at a specific ISI (p<0.05). B. The time constant for ISI interactions across LGN cells during stimulation with low-contrast and high-contrast gratings. The time constant was estimated as the ISI at which the ISI-efficacy curve decreased to e−1 of its maximum value, calculated separately for spikes recorded during stimulation with low- and high-contrast gratings.
Discussion
The primary goal of this study was to determine the relationship between stimulus contrast and retinogeniculate communication and test the hypothesis that both the time course and strength of retinogeniculate interactions are dynamically dependent on stimulus contrast. Our results show (1) the percentage of geniculate cell spikes evoked from a presynaptic RGC increases as contrast increases, (2) the percentage of RGC spikes that evoke postsynaptic LGN cell spikes increases as contrast increases, (3) when the relationship between ISI and spike efficacy is taken into account, the strength of individual RGC spikes is greater at low contrasts compared to high contrasts, and (4) the integration time for RGC inputs to evoke postsynaptic LGN cell spikes decreases as stimulus contrast increases. As discussed below, these findings have important implications for understanding the influence of contrast on the dynamics of retinogeniculate communication, the augmentation of contrast gain control in the LGN, and the involvement of extraretinal circuits in processing visual signals in the LGN.
Two measures that are particularly valuable for quantifying retinogeniculate communication between simultaneously recorded RGCs and LGN neurons are contribution and efficacy (Levick et al., 1972), where contribution is the percentage of LGN cell spikes evoked from a RGC and efficacy is the percentage of RGC spikes that evoke LGN cell spikes. Consistent with the notion that RGCs are the sole source of driving input to LGN neurons (reviewed in Sherman and Guillery, 2013), previous results have shown that essentially all LGN cell spikes can be attributed to retinal input (Kaplan & Shapley, 1984; Sincich et al., 2007). Although this rule had not been explored over a range of stimulus or behavioral conditions, we nevertheless anticipated finding contribution values for retinogeniculate communication to be invariant to changes in stimulus contrast. Instead, we found that contribution values are lowest for low-contrast stimuli and increase rapidly with contrast until a saturation point is reached (Figures 2 and 3).
Since LGN neurons in the cat visual system receive monosynaptic input from a small ensemble of RGCs (reviewed in Reid and Usrey, 2004), contrast-dependent changes in contribution could reflect the integration of convergent inputs from multiple RGCs. This could, in principle, be accomplished through synchrony between RGCs that increases with stimulus contrast; however, gap-junction mediated RGC synchrony has been shown to decrease, rather than increase, with increases in contrast (Trenholm et al, 2014). Another possibility is that EPSPs evoked from different RGCs that provide convergent input to a common LGN cell are more likely to interact and bring the LGN cell to spike threshold as contrast and firing rate increase. This mechanism could work in tandem with interactions between EPSPs, membrane conductance, and a noisy background in the LGN. Namely, during periods of low-contrast stimulation that are characterized by reduced levels of synaptic activity, low-amplitude EPSPs from nonretinal sources and/or intrinsic fluctuations in the membrane potential of LGN cells may be sufficient to trigger action potentials, thereby lowering the percentage of LGN cell spikes evoked directly from the retina. As stimulus contrast increases, increases in membrane conductance dampen the influence of any given input. Consequently, weaker input from nonretinal sources become less likely to trigger action potentials, thereby increasing the contribution of large retinal EPSPs to geniculate activity.
Results from this study and past studies demonstrate that a greater percentage of retinal spikes following short interspike intervals (ISIs) evoke LGN responses compared to retinal spikes following longer ISIs (see Figure 4; Mastronarde, 1987; Usrey et al., 1999; Levine & Cleland, 2001; Sincich et al., 2007; Weyand, 2007; Rathbun et al., 2010), likely the result of temporal summation in the LGN (Carandini et al., 2007; Casti et al, 2008). Because RGC firing rates increase with stimulus contrast, the distribution of ISIs during high-contrast stimulation is shifted toward shorter ISIs compared to the distribution during low-contrast stimulation (Rathbun et al., 2016). Consequently, the efficacy of retinogeniculate communication is predicted to increase with increasing contrast. Consistent with this prediction, our results show that RGC spikes are more effective, on average, during high-contrast stimulation compared to low-contrast stimulation (Figure 5).
With contrast gain control, the response gain (change in firing rate/change in stimulus contrast) is high at low contrast and low at high contrast. An important feature of contrast gain control is that it is augmented in the LGN compared to the retina (Kaplan et al., 1987; Scholl et al, 2012; Rathbun et al., 2016; but see Sclar, 1987). On the surface, this augmentation would seem to be at odds with the finding that the efficacy of RGC communication increases, on average, with stimulus contrast. We therefore performed two analyses to identify possible extraretinal mechanisms that contribute to augmented contrast gain control in the LGN. These analyses were aimed at examining the efficacy (i.e. strength) of retinal spikes produced during low- and high-contrast stimulation once contrast-dependent shifts in ISI distributions were taken into account. Results from these analyses reveal that individual retinal spikes are actually more effective at any given ISI under low-contrast conditions compared to high-contrast conditions and that the integration time for retinal spike interactions is decreased with contrast, both of which are consistent with the augmentation of contrast gain control in the LGN.
Similar to contrast gain control, extraclassical suppression is another form of gain control that is greater in the LGN than in the retina (Alitto & Usrey, 2015; Fisher et al., 2017). With extraclassical suppression, neuronal responses are diminished as stimuli extend beyond the classical receptive field (reviewed in Usrey & Alitto, 2015). Although the two forms of gain control are different in many respects, their augmentation in the LGN may rely, at least in part, on a common extraretinal mechanism (Solomon et al., 2002; Bonin et al., 2005). A likely candidate is polysynaptic inhibition. Like other forms of gain control, contrast gain control is often modeled as a form of divisive normalization and is one of several response properties that emerge due to nonlinear suppression (Duong & Freeman, 2008; Carandini & Heeger, 2011). Further, the precision of LGN responses suggest the presence of strong geniculate suppression that is slightly delayed relative to feed forward excitation from the retina (Butts et al., 2011, 2016; Fisher et al., 2017). This could be the result of intrathalamic synaptic inhibition from local inhibitory interneurons in the LGN or inhibitory cells in the thalamic reticular nucleus (TRN), both of which have the visual response and synaptic properties appropriate for providing retinotopically selective synaptic inhibition (Wang et al., 2011, Hirsch et al., 2015; Soto-Sanchez et al, 2017).
Synaptic depression of retinal inputs to LGN cells is another candidate mechanism that could contribute to the suppression of LGN activity at high contrasts. If it did make a contribution, then the strength of synaptic depression should be directly related to the RGC instantaneous firing rate (i.e., ISI) independent of stimulus contrast. As shown in Figures 5 and 6, however, retinal spike efficacy at matching ISIs does depend on stimulus contrast, which is inconsistent with the rate-dependence of synaptic depression.
Given that contrast gain control is established in the retina, one might wonder why it is augmented in the LGN rather than in the retina. One answer to this question rests on the anatomical relationship between the retina and LGN; the retinogeniculate pathway in mammals is not matched with a comparable feedback pathway. The LGN therefore represents the first station in the visual hierarchy where gain control can be influenced by extraretinal circuits involved with brain state, behavior, and higher level visual processing (reviewed in Guillery et al., 1998; Sherman & Guillery, 2013; Usrey and Alitto, 2015). Sources of modulation include feedback from primary visual cortex, cholinergic input directly from the brainstem or indirectly from the basal forebrain to the TRN, and the prefrontal cortex which modulates the LGN via the TRN during changes in attentional state. By modulating the timing and sensitivity of visual signals en route to cortex, the visual system therefore can tailor its activity to meet the behavioral and processing demands of the brain.
Acknowledgments
We thank K.E. Neverkovec, D.J. Sperka, and R. Oates for expert technical assistance. Supported by NIH grants EY013588 (wmu), E30 EY12576 (wmu), and the German Ministry for Education and Research, BMBF 031a308 (DLR).
Footnotes
Conflicts of Interest Statement: The authors declare that they do not have any conflicts of interest.
Data Accessibility Statement: All data are maintained at the University of California, Davis, and will be made available upon request.
Author Contributions – Project conception: HJA, DLR, WMU; Data collection: DLR, TGF, PCA, WMU; Data analysis: HJA, DLR; Manuscript writing and editing: HJA, WMU
References
- Alitto HJ, Usrey WM. Influence of contrast on orientation and temporal frequency tuning in ferret primary visual cortex. J Neurophysiol. 2004;91:2797–808. doi: 10.1152/jn.00943.2003. [DOI] [PubMed] [Google Scholar]
- Alitto HJ, Usrey WM. Surround suppression and temporal processing of visual signals. J Neurophysiol. 2015;113:2605–2617. doi: 10.1152/jn.00480.2014. [DOI] [PMC free article] [PubMed] [Google Scholar]
- Benardete EA, Kaplan E, Knight BW. Contrast gain control in the primate retina: P cells are not X-like, some M cells are. Visual Neurosci. 1992;8:483–486. doi: 10.1017/s0952523800004995. [DOI] [PubMed] [Google Scholar]
- Bonin V, Mante V, Carandini M. The suppressive field of neurons in lateral geniculate nucleus. J Neurosci. 2005;25:10844–10856. doi: 10.1523/JNEUROSCI.3562-05.2005. [DOI] [PMC free article] [PubMed] [Google Scholar]
- Butts DA, Cui Y, Casti AR. Nonlinear computations shaping temporal processing of precortical vision. J Neurophysiol. 2016;116:1344–57. doi: 10.1152/jn.00878.2015. [DOI] [PMC free article] [PubMed] [Google Scholar]
- Butts DA, Weng C, Jin J, Alonso JM, Paninski L. Temporal precision in the visual pathway through the interplay of excitation and stimulus-driven suppression. J Neurosci. 2011;31:11313–11327. doi: 10.1523/JNEUROSCI.0434-11.2011. [DOI] [PMC free article] [PubMed] [Google Scholar]
- Carandini M, Heeger DJ. Normalization as a canonical neural computation. Nat Rev Neurosci. 2011;13:51–62. doi: 10.1038/nrn3136. [DOI] [PMC free article] [PubMed] [Google Scholar]
- Carandini M, Horton JC, Sincich LC. Thalamic filtering of retinal spike trains by postsynaptic summation. J Vis. 2007;7:20.1–11. doi: 10.1167/7.14.20. [DOI] [PMC free article] [PubMed] [Google Scholar]
- Casti A, Hayot F, Xiao Y, Kaplan E. A simple model of retina-LGN transmission. J Comput Neurosci. 2008;24:235–252. doi: 10.1007/s10827-007-0053-7. [DOI] [PubMed] [Google Scholar]
- Cheng H, Chino YM, Smith EL, 3rd, Hamamoto J, Yoshida K. Transfer characteristics of lateral geniculate nucleus X neurons in the cat: effects of spatial frequency and contrast. J Neurophysiol. 1995;74:2548–2557. doi: 10.1152/jn.1995.74.6.2548. [DOI] [PubMed] [Google Scholar]
- Cleland BG, Dubin MW, Levick WR. Simultaneous recording of input and output of lateral geniculate neurones. Nature New Biol. 1971;231:191–192. doi: 10.1038/newbio231191a0. [DOI] [PubMed] [Google Scholar]
- Duong T, Freeman RD. Contrast Sensitivity Is Enhanced by Expansive Nonlinear Processing in the Lateral Geniculate Nucleus. J Neurophysiol. 2008;99:367–372. doi: 10.1152/jn.00873.2007. [DOI] [PubMed] [Google Scholar]
- Erisir A, Van Horn SC, Sherman SM. Relative numbers of cortical and brainstem inputs to the lateral geniculate nucleus. Proc Natl Acad Sci USA. 1997;94:1517–1520. doi: 10.1073/pnas.94.4.1517. [DOI] [PMC free article] [PubMed] [Google Scholar]
- Fisher TG, Alitto HA, Usrey WM. Retinal and non-retinal contributions to extraclassical surround suppression in the lateral geniculate nucleus. J Neurosci. 2017;37:226–235. doi: 10.1523/JNEUROSCI.1577-16.2016. [DOI] [PMC free article] [PubMed] [Google Scholar]
- Guillery RW. A quantitative study of synaptic interconnections in the dorsal lateral geniculate nucleus of the cat. Z Zellforsch. 1969;96:39–48. doi: 10.1007/BF00321474. [DOI] [PubMed] [Google Scholar]
- Guillery RW, Feig SL, Lozsádi DA. Paying attention to the thalamic reticular nucleus. Trends Neurosci. 1998;21:28–32. doi: 10.1016/s0166-2236(97)01157-0. [DOI] [PubMed] [Google Scholar]
- Hamos JE, Van Horn SC, Raczkowski D, Sherman SM. Synaptic Circuits Involving an Individual Retinogeniculate Axon in the Cat. J Comp Neurol. 1987;259:165–92. doi: 10.1002/cne.902590202. [DOI] [PubMed] [Google Scholar]
- Hirsch JA, Wang X, Sommer FT, Martinez LM. How inhibitory circuits in the thalamus serve vision. Annu Rev Neurosci. 2015;38:309–329. doi: 10.1146/annurev-neuro-071013-014229. [DOI] [PubMed] [Google Scholar]
- Kaplan E, Shapley R. The origin of the S slow. potential in the mammalian lateral geniculate nucleus. Exp Brain Res. 1984;55:111–116. doi: 10.1007/BF00240504. [DOI] [PubMed] [Google Scholar]
- Kaplan E, Purpura K, Shapley RM. Contrast affects the transmission of visual information through the mammalian lateral geniculate nucleus. J Physiol. 1987;391:267–288. doi: 10.1113/jphysiol.1987.sp016737. [DOI] [PMC free article] [PubMed] [Google Scholar]
- Levick WR, Cleland BG, Dubin MW. Lateral geniculate neurons of cat: retinal inputs and physiology. Invest Ophthalmol. 1972;11:302–311. [PubMed] [Google Scholar]
- Levine MW, Cleland BG. An analysis of the effect of retinal ganglion cell impulses upon the firing probability of neurons in the dorsal lateral geniculate nucleus of the cat. Brain Res. 2001;902:244–254. doi: 10.1016/s0006-8993(01)02411-8. [DOI] [PubMed] [Google Scholar]
- Mante V, Bonin V, Carandini M. Functional mechanisms shaping lateral geniculate responses to artificial and natural stimuli. Neuron. 2008;58:625–638. doi: 10.1016/j.neuron.2008.03.011. [DOI] [PubMed] [Google Scholar]
- Mastronarde DN. Two classes of single-input X-cells in cat lateral geniculate nucleus. II. Retinal inputs and the generation of receptive-field properties. J Neurophysiol. 1987;57:381–413. doi: 10.1152/jn.1987.57.2.381. [DOI] [PubMed] [Google Scholar]
- Rathbun DL, Alitto HJ, Warland DK, Usrey WM. Stimulus Contrast and Retinogeniculate Signal Processing. Front Neural Circuits. 2016;10:8. doi: 10.3389/fncir.2016.00008. [DOI] [PMC free article] [PubMed] [Google Scholar]
- Rathbun DL, Warland DK, Usrey WM. Spike timing and information transmission at retinogeniculate synapses. J Neurosci. 2010;30:13558–13566. doi: 10.1523/JNEUROSCI.0909-10.2010. [DOI] [PMC free article] [PubMed] [Google Scholar]
- Reid RC, Usrey WM. Functional connectivity in the pathway from retina to visual cortex. In: Chalupa LM, Werner JS, editors. The Visual Neurosciences. MIT Press; 2004. pp. 673–679. [Google Scholar]
- Scholl B, Latimer KW, Priebe NJ. A retinal source of spatial contrast gain control. J Neurosci. 2012;32:9824–9830. doi: 10.1523/JNEUROSCI.0207-12.2012. [DOI] [PMC free article] [PubMed] [Google Scholar]
- Sclar G. Expression of “retinal” contrast gain control by neurons of the cat’s lateral geniculate nucleus. Exp Brain Res. 1987;66:589–596. doi: 10.1007/BF00270692. [DOI] [PubMed] [Google Scholar]
- Shapley RM, Victor JD. The effect of contrast on the transfer properties of cat retinal ganglion cells. J Physiol. 1978;285:275–98. doi: 10.1113/jphysiol.1978.sp012571. [DOI] [PMC free article] [PubMed] [Google Scholar]
- Shapley RM, Victor JD. The effect of contrast on the non-linear response of the Y cell. J Physiol. 1980;302:535–547. doi: 10.1113/jphysiol.1980.sp013259. [DOI] [PMC free article] [PubMed] [Google Scholar]
- Sherman SM, Guillery RW. Thalamocortical Processing: Understanding the Messages that Link the Cortex to the World. Cambridge, MA: MIT Press; 2013. [Google Scholar]
- Sincich LC, Adams DL, Economides JR, Horton JC. Transmission of Spike Trains at the Retinogeniculate Synapse. J Neurosci. 2007;27:2683–2692. doi: 10.1523/JNEUROSCI.5077-06.2007. [DOI] [PMC free article] [PubMed] [Google Scholar]
- Solomon SG, White AJ, Martin PR. Extraclassical receptive field properties of parvocellular, magnocellular, and koniocellular cells in the primate lateral geniculate nucleus. J Neurosci. 2002;22:338–349. doi: 10.1523/JNEUROSCI.22-01-00338.2002. [DOI] [PMC free article] [PubMed] [Google Scholar]
- Soto-Sánchez C, Wang X, Vaingankar V, Sommer FT, Hirsch JA. Spatial scale of receptive fields in the visual sector of the cat thalamic reticular nucleus. Nat Commun. 2017;8:800. doi: 10.1038/s41467-017-00762-7. [DOI] [PMC free article] [PubMed] [Google Scholar]
- Trenholm S, McLaughlin AJ, Schwab DJ, Turner MH, Smith RG, Rieke F, Awatramani GB. Nonlinear dendritic integration of electrical and chemical synaptic inputs drives fine-scale correlations. Nat Neurosci. 2014;17:1759–1766. doi: 10.1038/nn.3851. [DOI] [PMC free article] [PubMed] [Google Scholar]
- Usrey WM, Alitto HJ. Visual functions of the thalamus. Ann Rev Vis Sci. 2015;1:351–371. doi: 10.1146/annurev-vision-082114-035920. [DOI] [PMC free article] [PubMed] [Google Scholar]
- Usrey WM, Reid RC. Synchronous activity in the visual system. Annu Rev Physiol. 1999;61:435–456. doi: 10.1146/annurev.physiol.61.1.435. [DOI] [PubMed] [Google Scholar]
- Usrey WM, Reid RC. Visual physiology of the lateral geniculate nucleus in two species of new world monkey: Saimiri sciureus andAotus trivirgatis. J Physiol. 2000;523:755–769. doi: 10.1111/j.1469-7793.2000.00755.x. [DOI] [PMC free article] [PubMed] [Google Scholar]
- Usrey WM, Reppas JB, Reid RC. Paired-spike interactions and synaptic efficacy of retinal inputs to the thalamus. Nature. 1998;395:384–387. doi: 10.1038/26487. [DOI] [PubMed] [Google Scholar]
- Usrey WM, Reppas JB, Reid RC. Specificity and strength of retinogeniculate connections. J Neurophysiol. 1999;82:3527–3540. doi: 10.1152/jn.1999.82.6.3527. [DOI] [PubMed] [Google Scholar]
- Wang X, Sommer FT, Hirsch JA. Inhibitory circuits for visual processing in thalamus. Curr Opin Neurobiol. 2011;21:726–33. doi: 10.1016/j.conb.2011.06.004. [DOI] [PMC free article] [PubMed] [Google Scholar]
- Weyand TG. Retinogeniculate transmission in wakefulness. J Neurophysiol. 2007;98:769–785. doi: 10.1152/jn.00929.2006. [DOI] [PubMed] [Google Scholar]