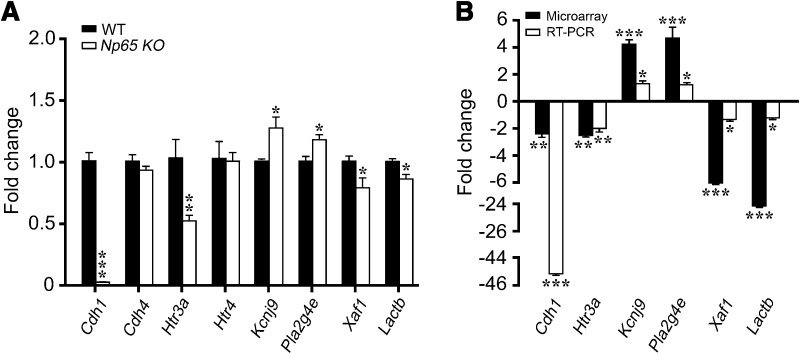
Fig. 3.
Relative expression levels of selected genes in Np65-KO and WT mice. A Results of quantitative real-time PCR (RT-PCR) (n = 4 mice). B RT-PCR and microarray experimental results for relative gene expression in Np65-KO and WT mice. The relative expression levels were calculated as the ratio of the target gene expression level to the β-actin expression level in the same sample. Fold changes are shown as mean ± SEM. *P < 0.05, **P < 0.01, ***P < 0.001.

