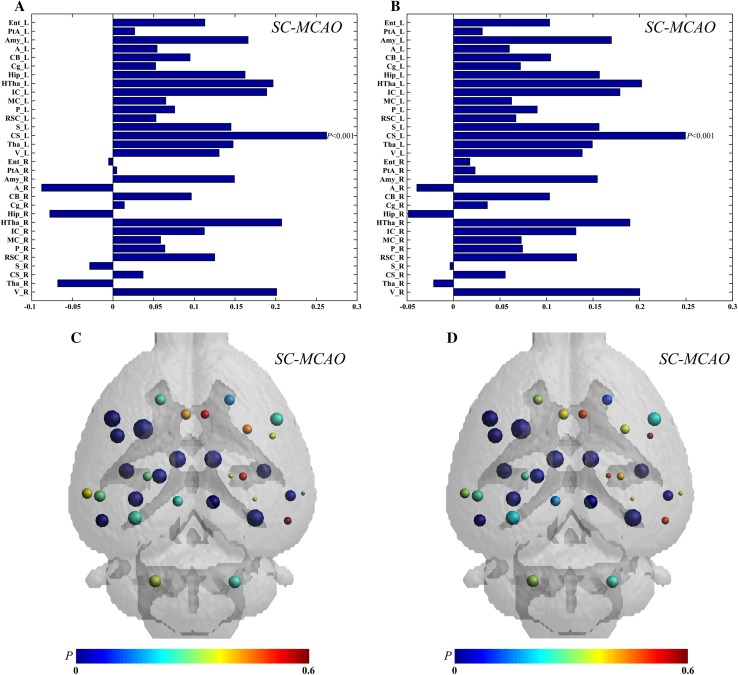
Fig. 4.
Regional graph theoretic measures. Differences of nodal efficiency (A) and local efficiency (B) for each node between the MCAO and sham groups. The largest difference was found in the ipsilesional striatum. The differences of nodes in nodal efficiency (C) and local efficiency (D) between the MCAO and sham groups are displayed in Paxinos and Watson space. The sizes of nodes represent differences between the MCAO and sham groups, and the colors of nodes represent P values. MCAO group, n = 8; SC group, n = 9.

