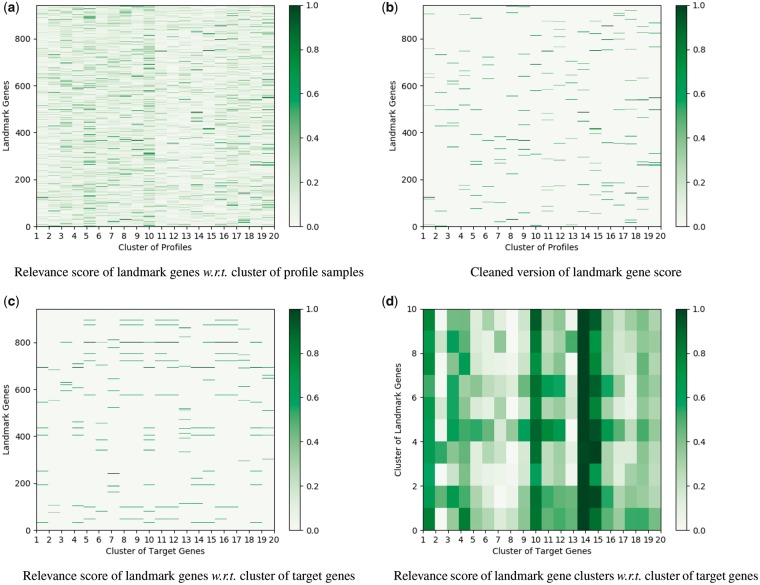
Fig. 3.
Illustration of the relevance score of different landmark genes calculated by the DenseNet architecture for the inference of GTEx data. (a) The gene expression profiles are divided into 20 clusters using K-means method. The contribution of each landmark gene to different profile clusters is plotted. (b) For each profile cluster, we only show the weights of the top 20 landmark genes with the largest contribution for a clear visualization. (c) The 9520 target genes are grouped into 20 clusters via K-means method. The contribution of each landmark gene to the prediction of different target gene clusters is plotted. (d) The landmark genes in Figure (c) are clustered into 10 groups. The contribution of each landmark gene cluster to the prediction of different target gene clusters is plotted

