Fig. 4.

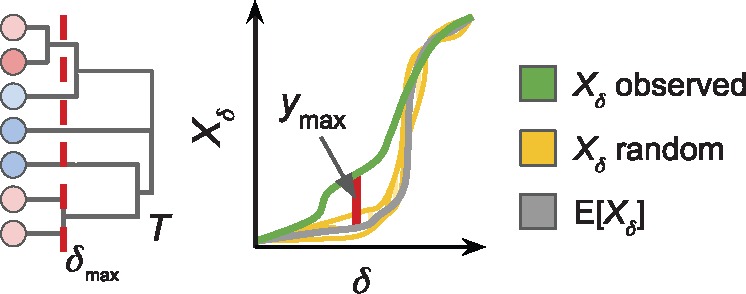
Left: Dendrogram T with similarity threshold δ of maximum deviation . Right: Maximum deviation between observed and expected largest cluster sizes

Left: Dendrogram T with similarity threshold δ of maximum deviation . Right: Maximum deviation between observed and expected largest cluster sizes