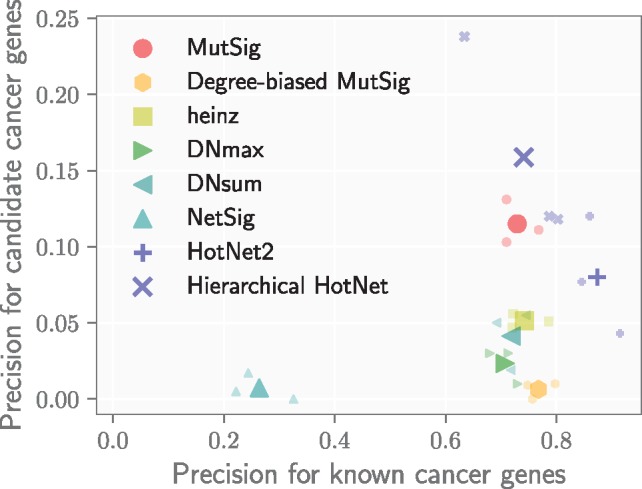
Fig. 5.

Precision on known cancer genes (x-axis) and on candidate cancer genes (defined in text; y-axis) for eight different methods using MutSig gene scores across three interaction networks. Smaller markers show the precision of a method on each network, and larger markers indicate the average precision of a method across networks
