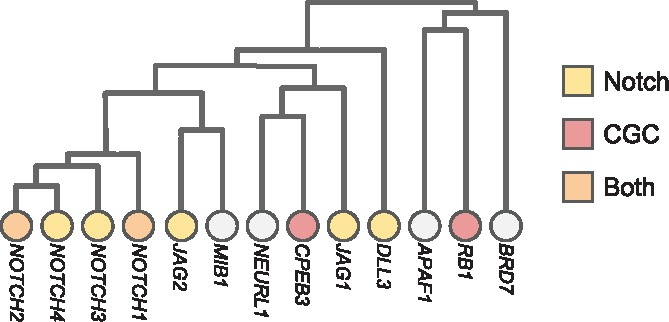
Fig. 6.

Branches of the Hierarchical HotNet hierarchy for the ReactomeFI interaction network and TCGA PanCanAtlas mutation frequency gene scores, where Notch signaling pathway and COSMIC CGC genes are indicated (branch heights roughly to scale)

Branches of the Hierarchical HotNet hierarchy for the ReactomeFI interaction network and TCGA PanCanAtlas mutation frequency gene scores, where Notch signaling pathway and COSMIC CGC genes are indicated (branch heights roughly to scale)