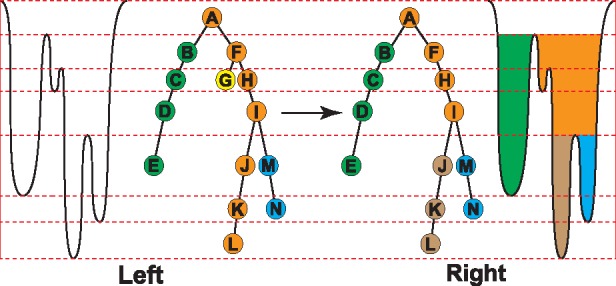
Fig. 2.

Left: Illustration of Reeb graph. The dashed line represents critical times for the filtration when there will be components newly born or killed. We have extracted four components labeled by different colors. Right: Illustration of a trimmed Reeb graph. The component (i.e. the yellow leaf) that lives for a short period is eliminated. Note that orange path is divided into two components (orange and brown), due to pocket hierarchical relation. Persistent objects are then marked by green, orange, brown and blue regions extracted from nodes B, F, J and M, respectively. Brown and blue are sub-pockets of orange
