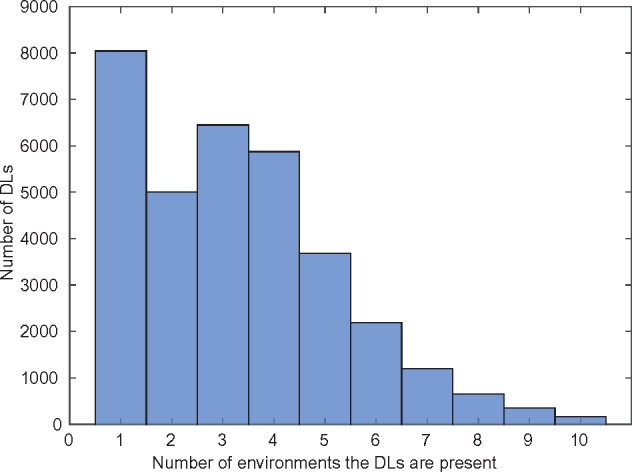
Fig. 3.

Distribution of DLs across environments. The histogram shows the number of DLs that are present in a given number of environments. For instance, the first bar shows that a large number of lethals (8043) were unique to only one environment, while the last bar shows that a small number of lethals (163) were found in each of the ten environments studied here
