
Fig. 4.
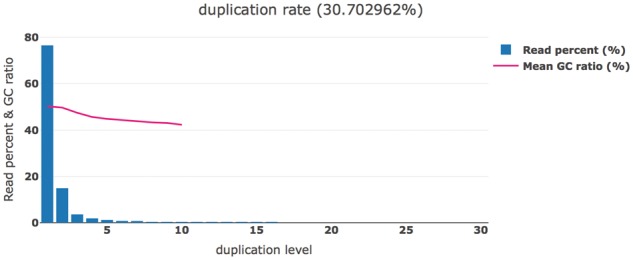
Duplication estimation. The read percentages and mean GC ratios of different duplication levels. The mean GC ratio curve is truncated since the reads with higher duplication level are too few to compute a stable mean value
Official websites use .gov
A
.gov website belongs to an official
government organization in the United States.
Secure .gov websites use HTTPS
A lock (
) or https:// means you've safely
connected to the .gov website. Share sensitive
information only on official, secure websites.
Duplication estimation. The read percentages and mean GC ratios of different duplication levels. The mean GC ratio curve is truncated since the reads with higher duplication level are too few to compute a stable mean value