
Fig. 5.
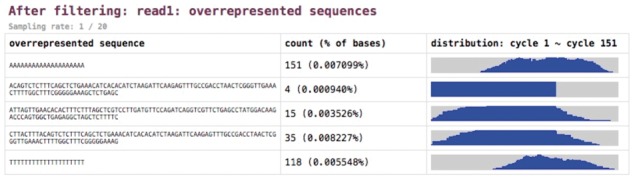
Overrepresented sequence analysis results. The right column shows the histogram of occurrence among all sequencing cycles
Official websites use .gov
A
.gov website belongs to an official
government organization in the United States.
Secure .gov websites use HTTPS
A lock (
) or https:// means you've safely
connected to the .gov website. Share sensitive
information only on official, secure websites.
Overrepresented sequence analysis results. The right column shows the histogram of occurrence among all sequencing cycles