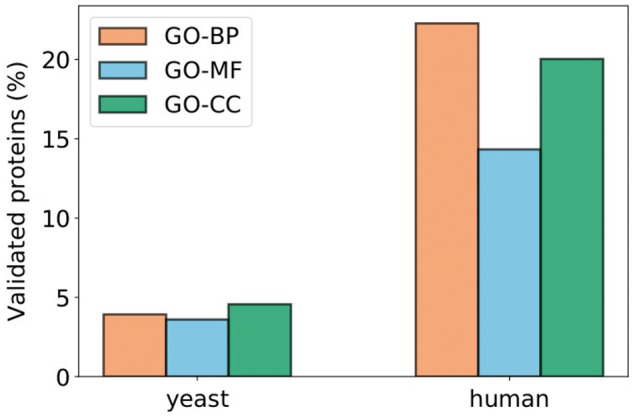
Fig. 10.

Percentages of proteins that have at least one of the enriched terms of their clusters in their set of predicted GO annotations (obtained from the GO database; Blake et al., 2015). The values correspond to the number of such proteins out of the number of proteins that have at least one putative annotation in the GO database and are not experimentally annotated with any of the enriched terms of their clusters
