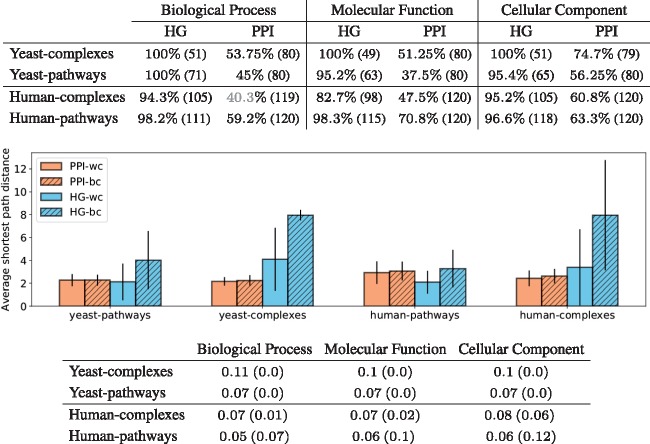
Fig. 5.
The top table presents the maximum enrichment measured across clusterings obtained with the ‘optimal’ number of clusters (80 for yeast and 120 for human). The number in parenthesis is the number of non-empty clusters. The colour indicates the statistical significance of the maximum enrichment with respect to random permutation tests: black indicates a significant value, grey a non-significant one. The middle panel gives, for each type of model (HG in blue and PPI in orange), the average of the shortest path lengths within the clusters (wc) and between clusters (bc) of the best clustering obtained for GO–BP annotations. The results are similar for other GO categories and are not presented here due to space limitations. The bottom table presents the results of comparing the obtained clusterings. We use the HG clustering as baseline and compute the AMI between the clusterings and the JI (in parenthesis) between the sets of enriched GO terms

