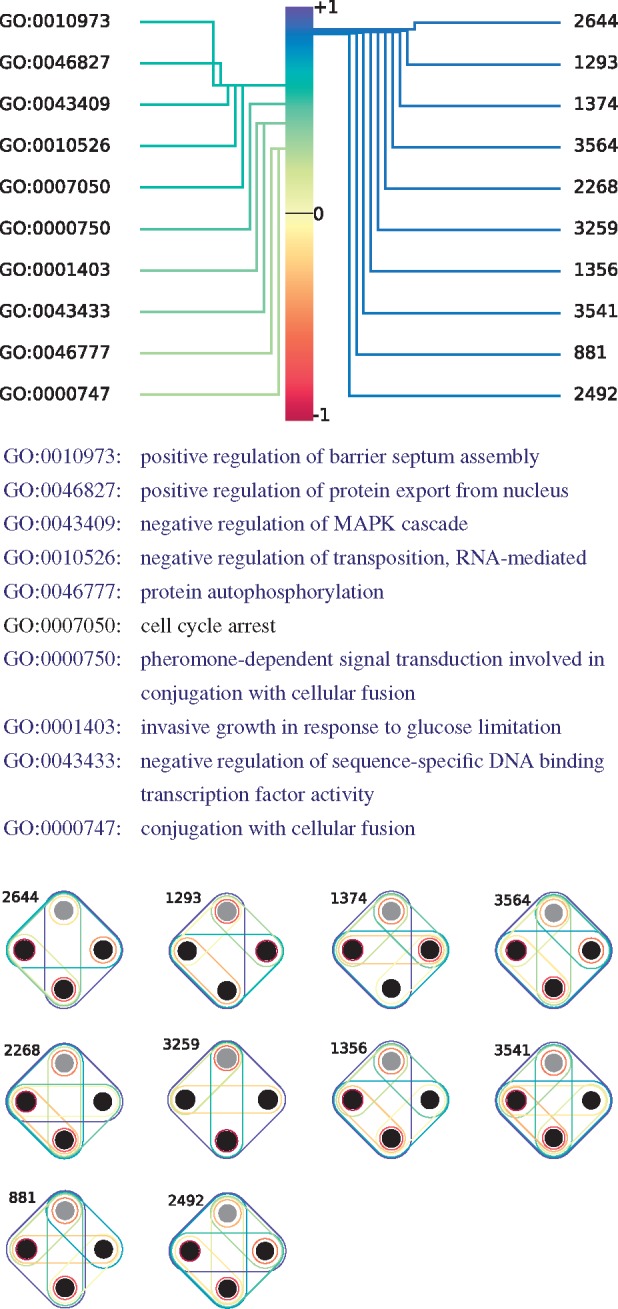
Fig. 7.

The most significant CCA variate between HDVs of the proteins of yeast–pathways and their GO-BP annotations. The correlation score between the linear combination of annotations and the linear combination of hypergraphlet orbits is 1. The annotations (orbits) illustrated above correspond to the 10 that have the highest Pearson’s correlation scores with respect to the linear combinations of annotations (orbits). Each GO term in blue font is annotating at least one protein conjointly with at least one other annotation that is also denoted in blue font, according to QuickGO ontology search engine (Binns et al., 2009)
