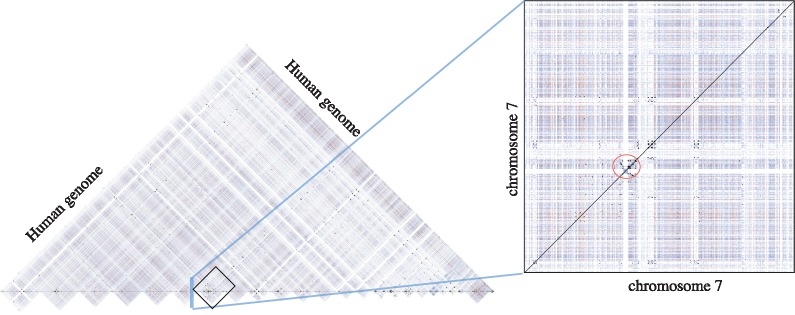
Fig. 5.
Visualization of ≥1 Kbp duplications in the human genome computed using Mashmap2. Alignments are colored based on their lengths: blue 1–5 Kbp, red 5–10 Kbp, black >10 Kbp. Majority of blue and red mappings occur due to SINEs and LINEs repeats, respectively. Right plot is a magnification of ≥1 Kbp duplications within chromosome 7. Chromosome 7 is known to be one of the most duplicated human chromosomes. Large clustered duplications in red circle are associated with Williams-Beuren syndrome (Hillier et al., 2003)

