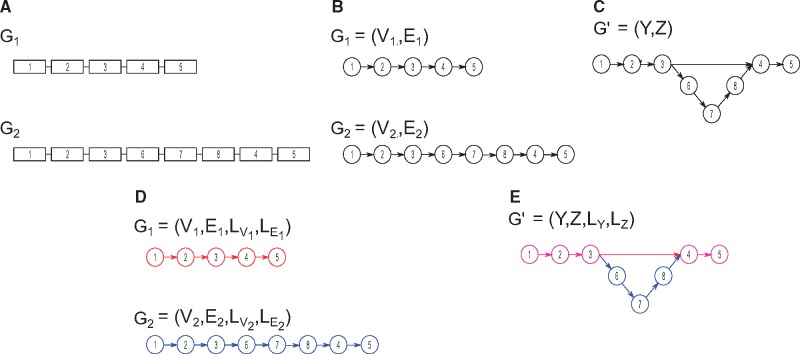
Fig. 1.
Representing genome architectures as graphs. Panel (A) shows two genomes, G1 and G2, each containing a single chromosome with five to eight genes. Panel (B) shows graphical representation of genomes G1 and G2. Merging similar nodes in the genome graphs shown previously results in a new graph, (C). The addition of labels to nodes and edges results in a labeled multi-directed graph, also known as quivers. Panel (D) shows the quiver representation for genomes G1 and G2—in this case the colors correspond to the labels of G1 and G2. Merging of the two quivers similarly results in (E), the canonical quiver representation of genomes G1 and G2

