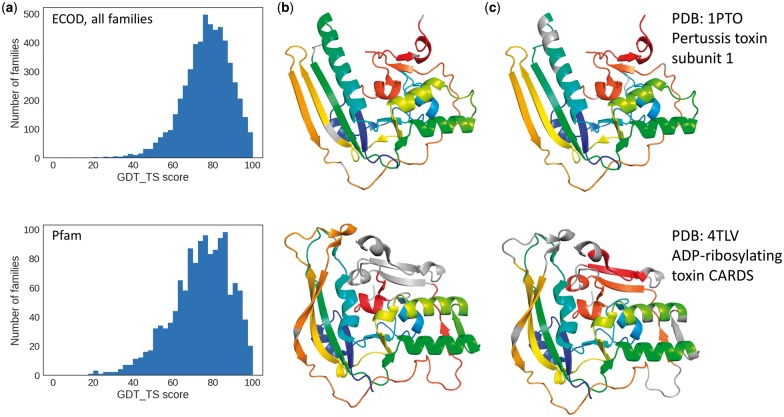
Fig. 2.
Validation of ECOD family alignment. (a) The distribution of the average GDT_TS score per family of all ECOD and Pfam families. (b) An example of Pfam alignment with registry shift mapped on the structures. Aligned residues are colored the same in rainbow from N-terminus. (c) ECOD family alignment of the same protein pair mapped on the structures. Proper gaps are made to handle loops and corresponding elements of different lengths

