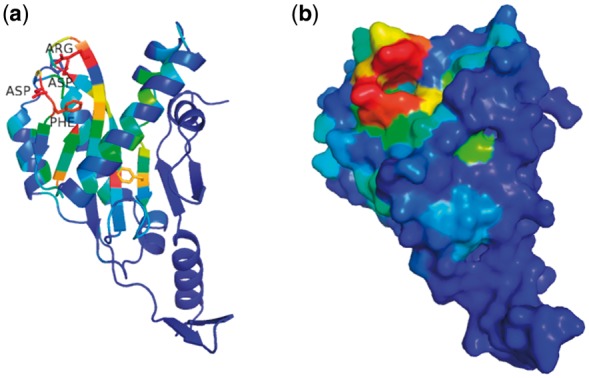
Fig. 4.

Structure of TagF colored by conservation shows a potential function site. (a) The structure of TagF (PDB: 2QNU) is rendered in cartoon and colored in rainbow by sequence conservation derived from family alignment. The conservation index is normalized, and red means the most conserved region. Side chains of the conserved residues are shown, and the names of several residues forming a pocket are labeled. (b) The surface of the same colored TagF structure is shown, highlighting a conserved pocket, which could be function-related
