
Fig. 8.
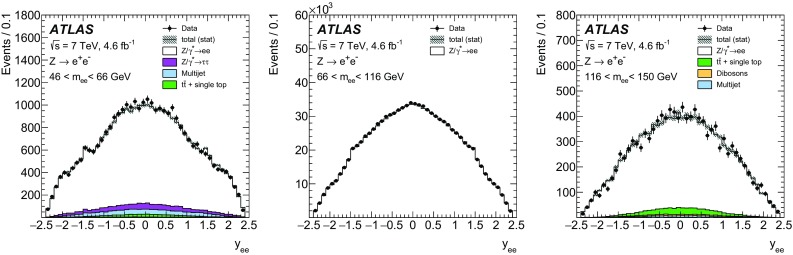
The dilepton rapidity distributions for candidates with two central electrons in the mass regions (left), (middle) and (right). The simulated samples are normalized to the data luminosity. The multijet background shape is taken from a data control sample and normalized to the estimated yield of multijet events. The sum of all expected background and signal contributions is shown as a solid line with a hashed band detailing the statistical uncertainty and labelled “total (stat)”. The legend lists only background sources with a visible contribution