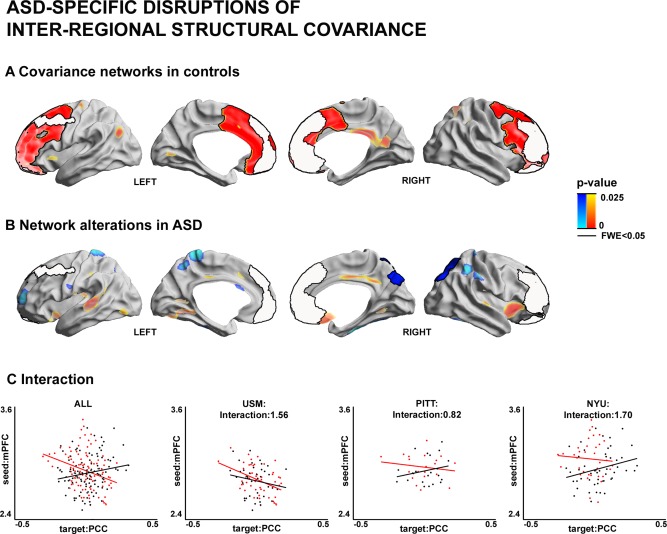
Figure 2.

Inter‐regional structural covariance network analysis. Seed regions were determined as clusters of cortical thickness increases in ASD (see Fig. 1). (A) Covariance networks in controls. Significant correlations between cortical thickness in the seed and a cortical target region across the sample were interpreted as structural networks. (B) Alterations in structural covariance networks between ASD and controls. Blue/Red areas indicate reductions/increases in seed covariance in ASD relative to controls. (C) Scatter plots illustrating the interaction showing in (B), between mean thickness of right PFC seed and mean thickness of right PCC/PCU target region, once for the overall sample and once within each site (i.e., USM/PITT/NYU). Please, see Figure 1 for details on the statistical thresholding.
