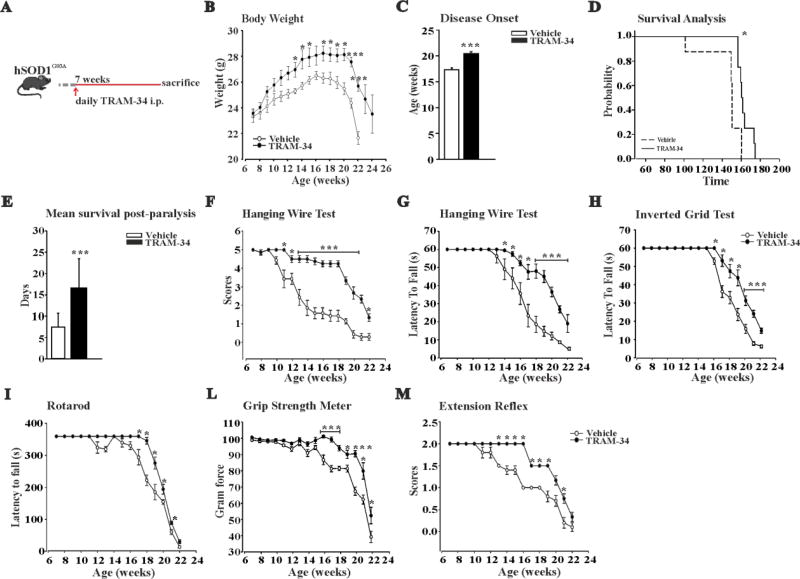
Figure 2. KCa3.1 channels modulate motor function and survival in hSOD1G93A mice.
A: Treatment scheme. B: Variations of body weight over time in vehicle (white) and TRAM-34-treated hSOD1G93A mice (black dots). Data are the mean ± SEM; *p<0.05, ** p<0.01, *** p<0.001 vs vehicle by Student's t-test n= 9. C: Disease onset index, calculated as the age of peak of body weight. Disease onset in TRAM-34 treated mice was 19.3 ± 0.2 weeks, black bars; in vehicle 16.3 ± 0.2 weeks, white bars. Data are the mean ± SEM *** p<0.001, n=9. D: Kaplan–Meier analysis of mice survival. TRAM-34 increased the survival time of hSOD1G93A mice (TRAM-34: 165 ± 2 days; vehicle: 148 ± 7 days, data are the mean ± SEM *p<0.008 by Log–rank test, n=9). E: Quantification of the mean survival time post-paralysis. TRAM-34: 16.6 ± 2.41 days (black bar); vehicle: 7.4 ± 0.97 days (white bar) data are the mean ± SEM, n=9 ***p<0.001 by Student's t test. F–M: Analyses of motor function in SOD1G93A mice treated with TRAM-34 (black dots) or vehicle (white dots) with: hanging wire test, score (F) and latency (G), inverted grid test (H), rotarod test (I), grip strength test (force) (L) and extension reflex (M). Behavioral tests were performed once a week, starting from 7-weeks of age until weeks described in the panels. All behavioral tests were ameliorated by TRAM-34 treatment. Data are expressed as mean ± SEM; *p<0.05, ** p<0.01, *** p<0.001 vs vehicle hSOD1G93A mice by Student's t-test n= 9.

