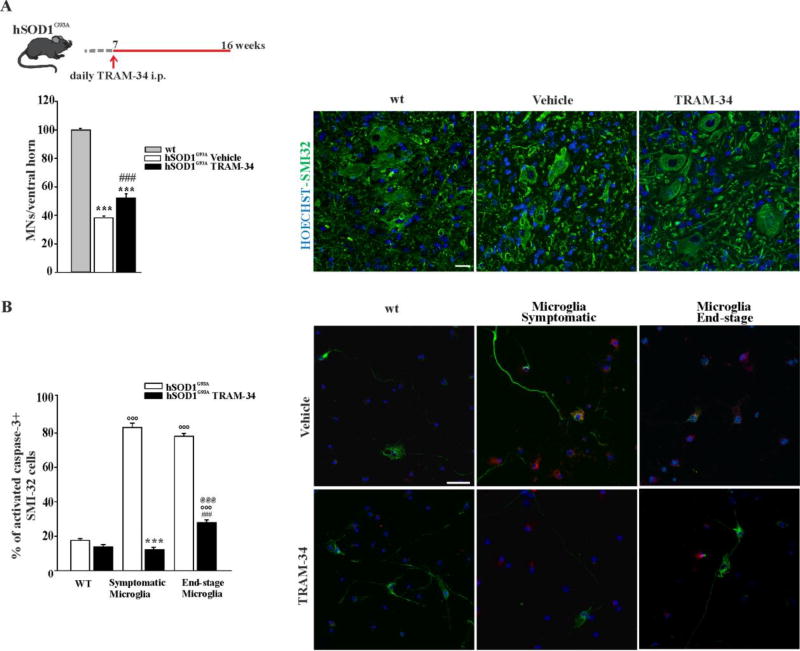
Figure 3. KCa3.1 channels modulate microglia-motor neuron interaction in hSOD1G93A mice.
A: top, treatment scheme. Bottom, quantification of MNs (counted as SMI-32 stained cells in the ventral horns of the spinal cord) in non-tg wt, and hSOD1G93A mice treated with vehicle or TRAM-34. Data are shown as mean ± SEM ***p<0.001 vs wt; ###p<0.001 vs vehicle by One Way ANOVA, TRAM-34 n=6; Vehicle n=5; wt n=3). Representative immunofluorescence images are shown on the right (scale bar=20µm). B Non-tg wt MNs co-cultured with microglia isolated from the spinal cord of wt, symptomatic or end-stage hSOD1G93A mice treated with TRAM-34 (2.5 µM, black bars) or DMSO (white bars). After 72 h, MN death was quantified counting the activated caspase 3/SMI32 double positive cells. Data are mean ± SEM; n=3 in triplicate, °°°p<0.001 vs wt microglia, ***p<0.001 vs symptomatic microglia, ###p<0.001 vs end-stage microglia, @@@p<0.001 vs wt microglia+TRAM-34 by Two Way ANOVA (Holm-Sidak method): Representative immunofluorescence images are shown on the right (scale bar=20µm).

