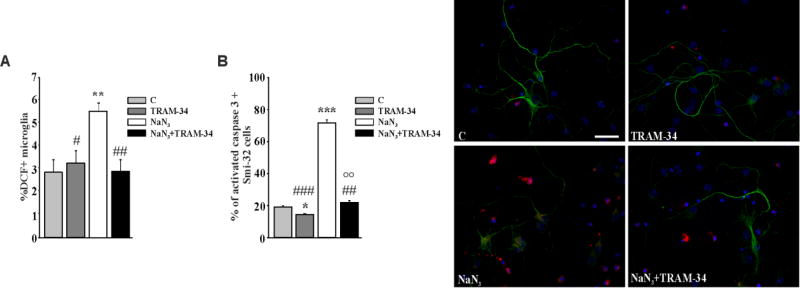
Figure 4. MNs are protected against ROS neurotoxicity by TRAM-34 treated microglia.
A: Quantification of ROS production in non-tg wt microglia treated with NaN3 (5µM), vehicle (DMSO, control) or TRAM-34 (2.5 µM) for 18 h, measured as dichlorofluorescein positive cells by cytofluorimetry (Data are expressed as % of DCF+ microglia, mean ± SEM, n=3 in triplicate, **p=0.005 vs C; #p=0.048, ##p=0.004 vs NaN3 by Two Way ANOVA (Holm-Sidak method). B: Cell death quantification of MNs co-cultured for 24h with non-tg wt microglia pre-treated as in A. Data are expressed as % of active-caspase 3/SMI32 double positive cells on SMI32 positive cells in each condition and are the mean ± SEM. n=3 in triplicate, ***p<0.001, *p=0.037 vs control, ## p=0.003, ### p<0.001 vs NaN3, °°p=0.003 vs TRAM-34 by Two Way ANOVA (Holm-Sidak method). Representative immunofluorescence images are shown on the right (scale bar=20µm).

