
Figure 1. Localization of CTB injection sites in the amygdala.
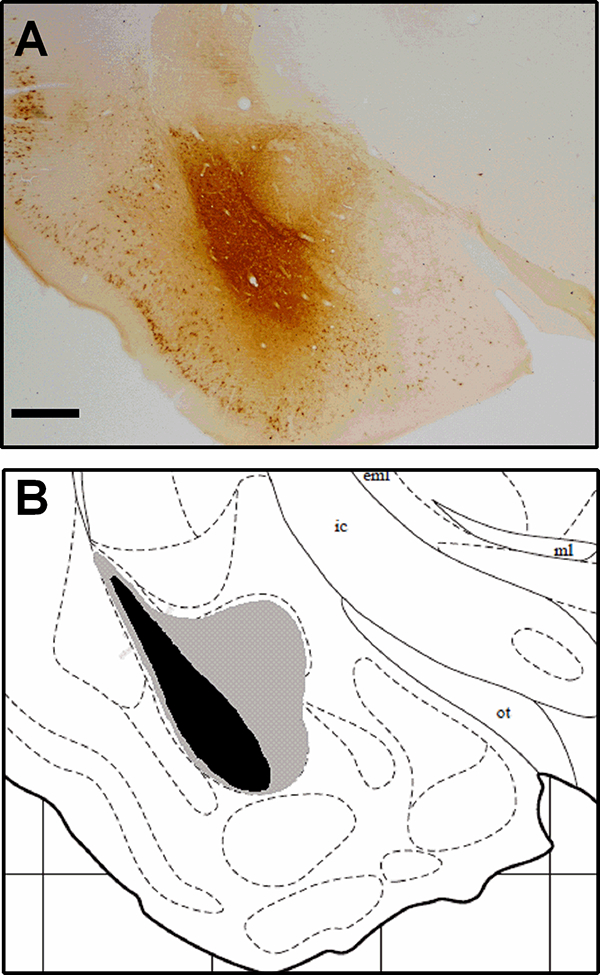
A) Photomicrograph from representative image of CTB immunohistochemistry in the amygdala at 2× magnification. Scale bar = 500μm. B) Schematic images of maximal and minimal CTB spread; gray indicates hamsters with maximal CTB spread, and black indicates hamsters with the smallest injection of CTB. Atlas image was adapted from Morin and Wood (2001).