
Figure 2. Co-localization of c-Fos and CTB.
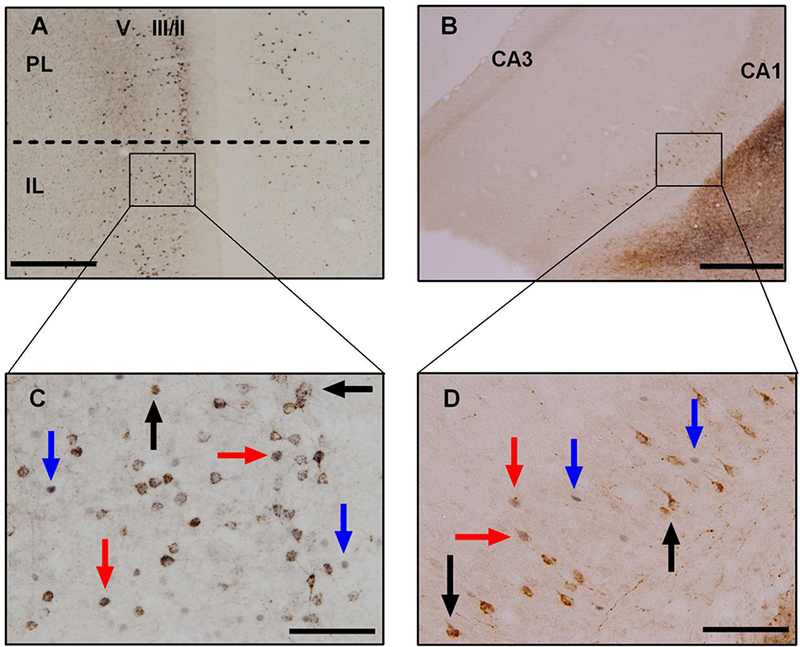
Photomicrographs from representative images of c-Fos + CTB dual immunohistochemistry in A) the IL at 4× magnification, in B) the vHPC at 4× magnification, in C)the IL at 20× magnification, and finally in D) the vHPC at 20× magnification. Cells with brown cytoplasmic staining (black arrows) are CTB positive, cells with black nuclear staining (blue arrows) are c-Fos positive, and cells with black nuclear staining surrounded by brown cytoplasmic staining (red arrows) are c-Fos + CTB positive. Scale bar = 500 μm at 4× magnification, while scale bar = 100 μm at 20× magnification.