
Figure 3. Comparison of c-Fos + CTB staining in the IL.
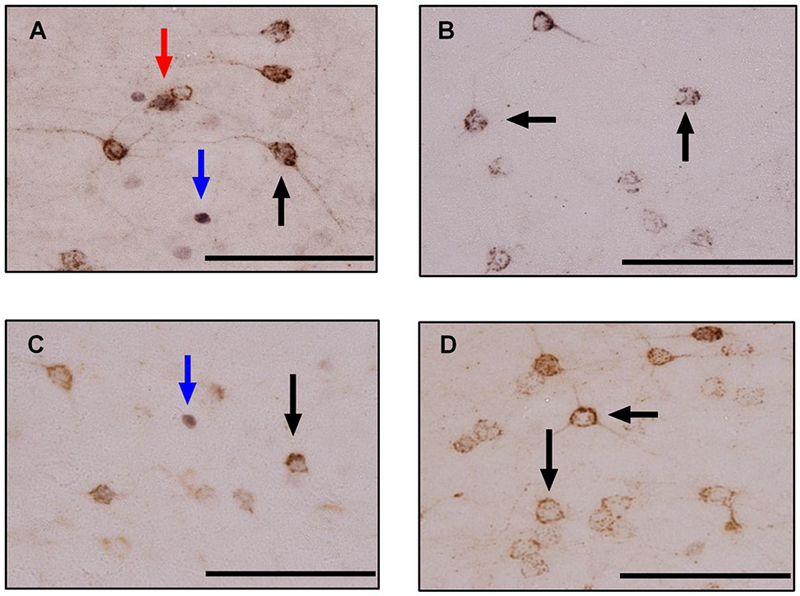
Photomicrographs of c-Fos + CTB dual immunohistochemistry at 40× magnification from a representative A) dominant, B) subordinate, C) social status control, and D) no defeat control. Cells with brown cytoplasmic staining (black arrows) are CTB positive, cells with black nuclear staining (blue arrows) are c-Fos positive, and cells with black nuclear staining surrounded by brown cytoplasmic staining (red arrows) are c-Fos + CTB positive. Scale bar = 100 μm.