
Figure 4. Dominance status modulates neural activity in both PL-to-BLA/CeA and IL-to-BLA/CeA projections, but not in a vHPC-to-BLA/CeA projection.
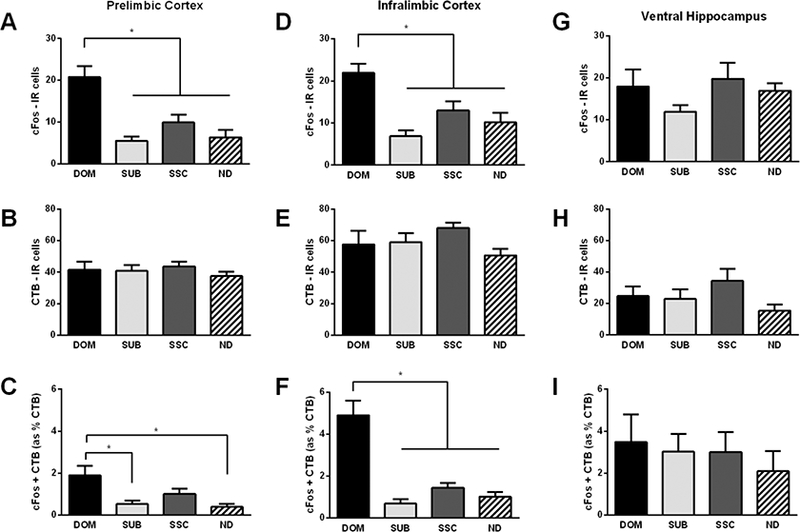
In the PL, A) dominants (DOM, n = 9) display significantly greater c-Fos-IR compared to subordinates (SUB, n = 12), social status controls (SSC, n = 12), and no defeat controls (ND, n = 11). B) No significant differences were found in CTB-IR. C) Dominants display a significantly greater proportion of double-labeled c-Fos + CTB-IR compared to subordinates and no defeat controls. In the IL, D) dominants (n = 9) display significantly greater c-Fos-IR compared to subordinates (n = 12), social status controls (n = 12), and no defeat controls (n = 11). E) No significant differences were found in CTB-IR. F) Dominants display a significantly greater proportion of double-labeled c-Fos + CTB-IR compared to subordinates, social status controls, and no defeat controls. In the vHPC, no significant differences were found in G) c-Fos-IR (DOM, n = 7; SUB n = 12; SSC, n = 12, and ND, n = 12), H) CTB-IR, or I) the proportion of double-labeled c-Fos + CTB-IR. The above data includes animals with both BLA and BLA/CeA hits. Data are shown as mean ± SEM. An asterisk indicates a significant difference between groups as determined by a Tukey’s post hoc test (*p < 0.05).