
Figure 4.
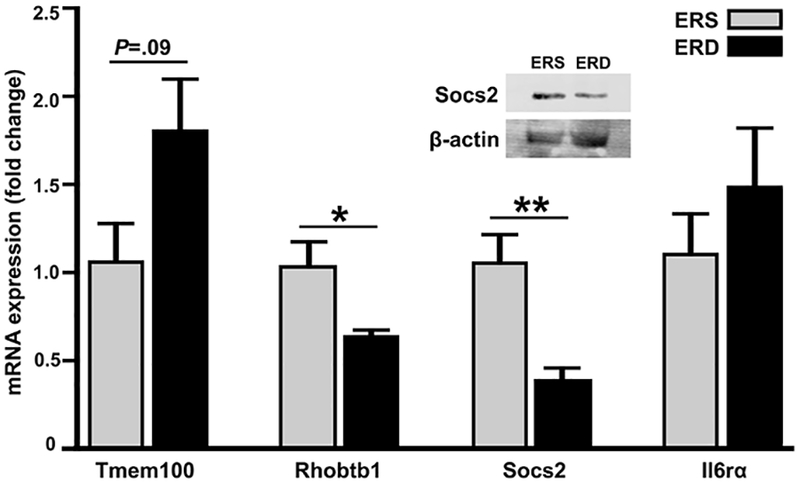
Relative mRNA expression of Tmem100, Rhobtbb1, Socs2, and I16rα (negative control) and protein expression of Socs2 and β-actin (control) in skeletal muscle in female C57BL/6 mice fed ERS and ERD diets. Values are means ± standard errors of RT-qPCR analysis. *P<0.05, **P<0.01 vs. ERS-fed mice (n=4).