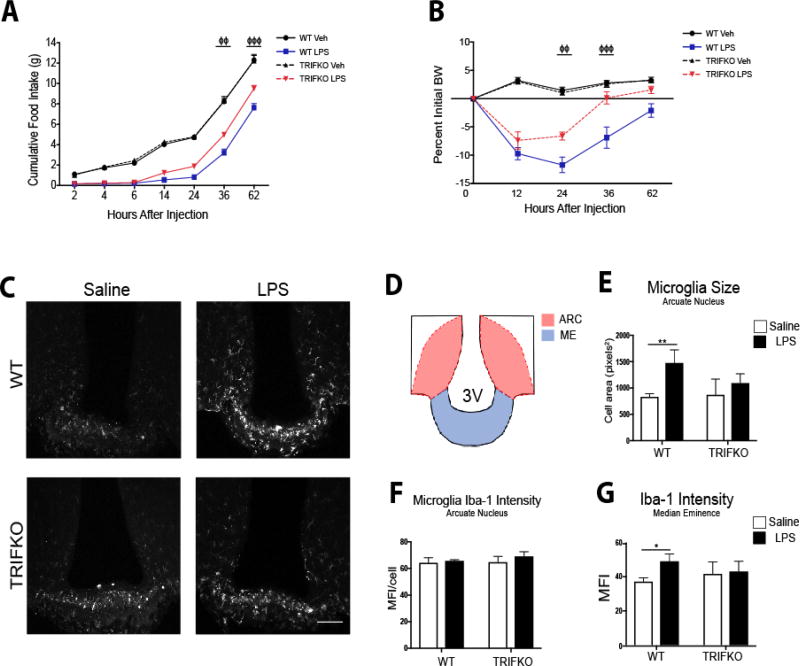
Figure 3. TRIFKO mice have attenuated acute sickness behavior in response to central nervous system LPS exposure.
A) Cumulative food intake after 50 ng ICV LPS treatment. Veh = vehicle treatment. B) Body weight change after 50 ng ICV LPS treatment. BW = body weight. For A and B ΦΦ = p<0.05, ΦΦΦ = p<0.001 for WT LPS vs. TRIFKO LPS in Two-Way ANOVA Bonferroni post hoc comparisons. N = 5–6/group. C) Representative images of Iba-1 immunoreactivity in 200× magnification images of the MBH in WT and TRIFKO mice after either 50 ng ICV LPS or saline. Scale bar = 100 µm. D) Cartoon of MBH depicting regions of interest for quantification. ARC = arcuate nucleus, ME = median eminence. E) Quantification of arcuate nucleus microglia size (area) in pixels2 after either ICV LPS or saline. F) Quantification of Iba-1 intensity per microglia in the arcuate nucleus in WT and TRIFKO mice after either ICV LPS or LPS saline. G) Quantification of Iba-1 intensity in the median eminence in WT and TRIFKO mice after either ICV LPS or LPS saline. For E–G * = p<0.05, ** = p<0.01 for Bonferroni post hoc comparisons comparing saline-treated animals to LPS-treated animals within the same genotype. n = 4/group.

