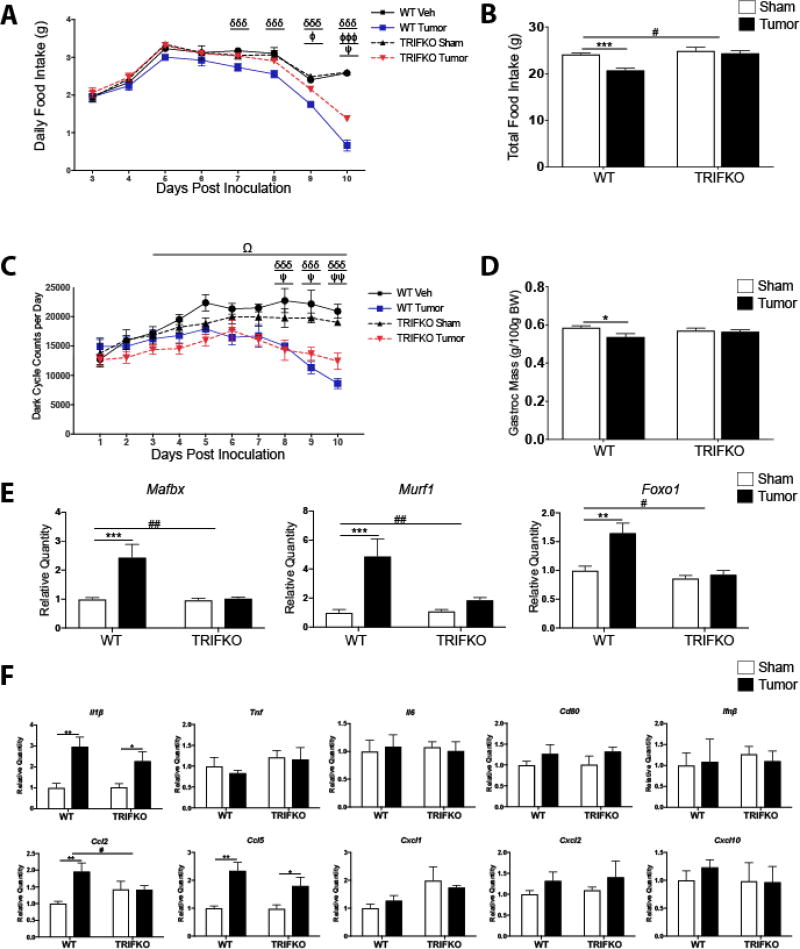
Figure 5. TRIFKO mice have attenuated cancer cachexia.
A) Daily food intake after a single orthotopic inoculation of 3e6 KPC tumor cells. δδδ = p<0.001 for WT sham vs. WT tumor in Bonferroni post hoc comparisons. Φ = p<0.05, ΦΦΦ = p<0.001 for WT tumor vs. TRIFKO tumor in Bonferroni post hoc comparisons. Ψ = p<0.05 for TRIFKO sham vs. TRIFKO tumor in Bonferroni post hoc comparisons. B) Cumulative food intake 10 days post inoculation. *** = p<0.001 for WT sham vs. WT tumor in Bonferroni post hoc comparisons. # = p<0.05 for interaction in Two-way ANOVA. C) Movement quantification after inoculation with KPC tumor cells. Movement quantified using a Minimitter system with e-mitter implanted subcutaneously in between shoulder blades. δδδ = p<0.001 for WT sham vs. WT tumor in Bonferroni post hoc comparisons. Ψ = p<0.05, ΨΨ = p<0.01 for TRIFKO sham vs. TRIFKO tumor in Bonferroni post hoc comparisons. Ω = p<0.05 for Three-way ANOVA interaction effect between genotype and treatment for days 3–10 post inoculation. D) Muscle catabolism determined by gastrocnemius mass. Mass of dissected left and right gastrocnemius was averaged and then divided by initial body weight for normalization. * = p<0.05 for WT sham vs. WT tumor in Bonferroni post hoc comparisons. E) qRT-PCR analysis of muscle catabolism genes in gastrocnemius. Expression level for all groups was normalized to WT sham. ** = p<0.01, *** = p<0.001 for WT sham vs. WT tumor in Bonferroni post hoc comparisons. # = p<0.05, ## = p<0.01 for interaction effect in Two-way ANOVA. F) Expression of inflammatory cytokine genes in the hypothalamus 10 days after orthotopic inoculation with KPC tumor cells. All data are analyzed from ΔCt values and normalized to WT sham group. * = p<0.05, ** = p<0.01, for WT sham vs. WT tumor in Bonferroni post hoc comparisons. # = p<0.05, for interaction effect in Two-way ANOVA. N = 5/group for all experiments. Data are representative from 3 independent experiments.

