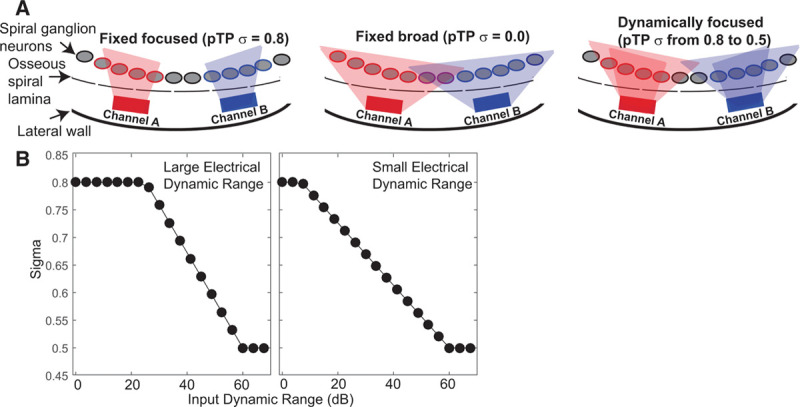
Fig. 1.

Schematic of dynamic focusing and the relationship between sigma and level. A, Two cochlear implant channels are represented by rectangles, spiral ganglion neurons by gray ovals, and the edge of the osseous spiral lamina by a dashed line. The spatial extent of currents required to activate neurons for each channel are indicated by the shaded areas. Partial tripolar with a fixed focused configuration is shown on the left (TP); the σ focusing coefficient was fixed at 0.8. The middle drawings show the monopolar (MP) configuration; σ was fixed at 0. The new dynamically focused configuration is shown on the right. This new mode stimulates with a highly focused configuration for threshold inputs (σ = 0.8) and a broader configuration for input levels near most comfortable levels (σ = 0.5). B, Two examples of the rate of change of the focusing coefficient as a function of the input stimulus level for a 60-dB input dynamic range (Litvak et al. 2007). The left panel shows an example channel with a large electrical dynamic range, while the right panel shows a channel with a small electrical dynamic range.
