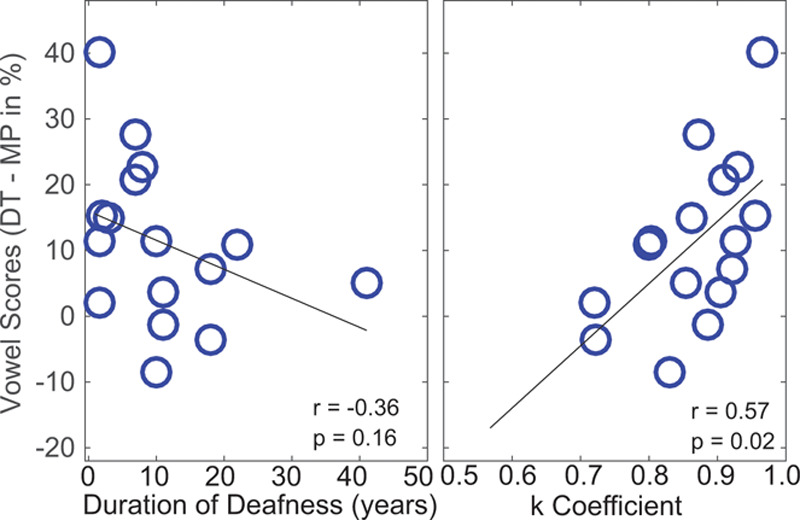
Fig. 5.

The difference between performance on vowel identification in noise with DT minus performance with MP (ordinate) is plotted as a function of duration of deafness (left) and as a function of estimated K coefficient (right). Each circle represents data from one subject, and only subjects tested in background noise were included. DT indicates dynamic tripolar; MP, monopolar.
