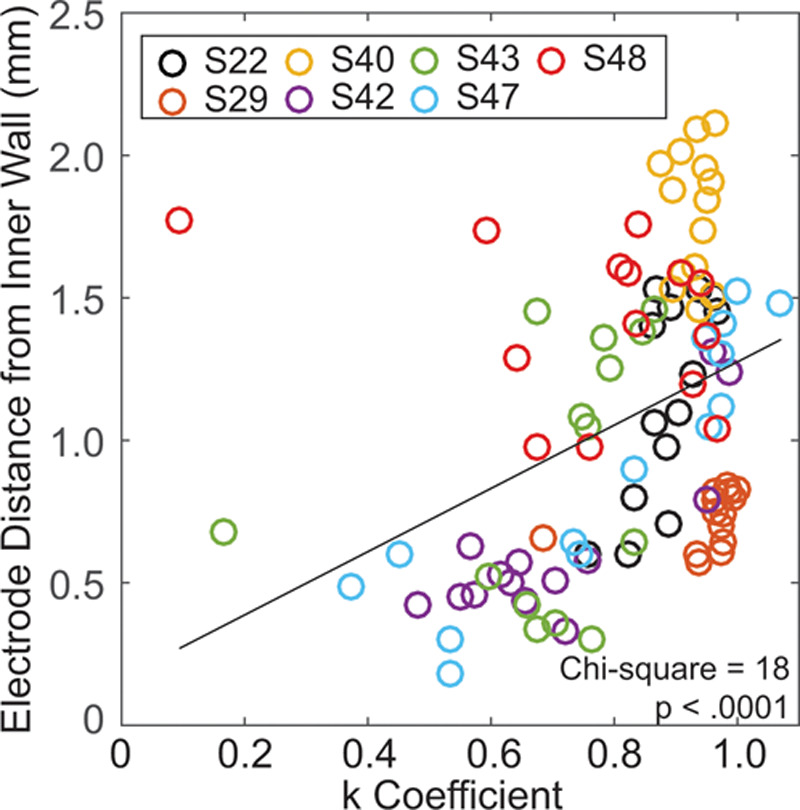
Fig. 6.

The computed tomography–estimated distance of each electrode from the inner wall of the cochlea is plotted as a function of estimated K coefficient. Each subject is represented by color with multiple data points for each electrode (14 per subject). The black line is a least-squares, best fit line to the data.
