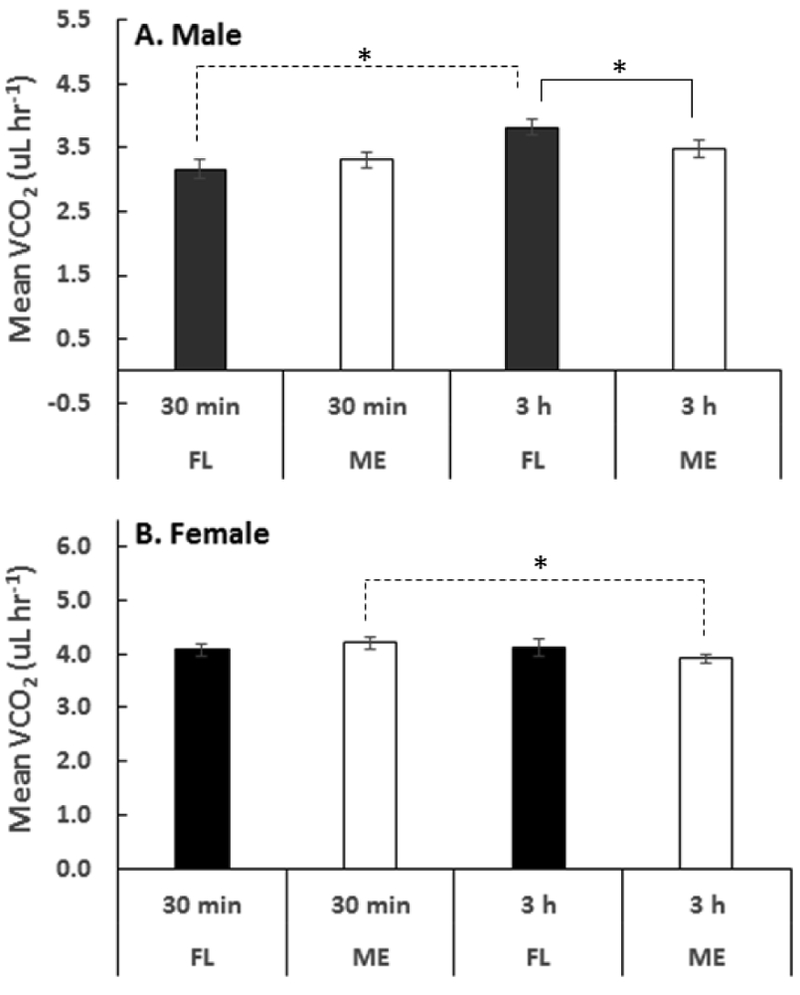
Figure 5:

Carbon dioxide emission rates for males (A) and females (B) of D. melanogaster populations from Florida (HFL) and Maine (ME). Measurements were done at two time points (30 min and 3hr). Asterisks indicate a significant difference between measurements conducted at the two timepoints (α=0.05). Within population differences (for FL males and ME females) measured at two-time points (30min and 3hr) are shown with dashed line connections. The differences at the population level are shown with the solid lines connections. After 3h, FL males have higher values than ME males. In comparing FL males 30min to 3h treatment, there is a significant increase in VCO2. In females, ME flies show a decrease in VCO2 going from 30min to 3hr.
