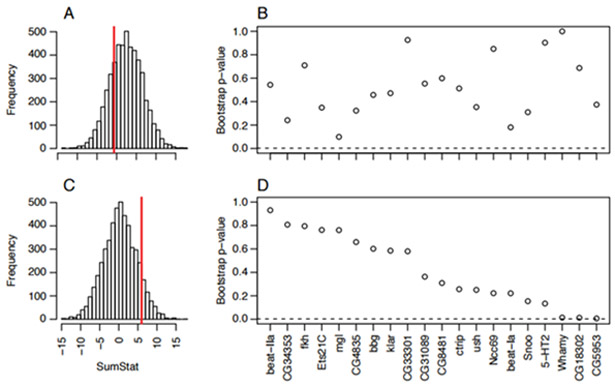
Figure 7:

Signals of clinality among North American and Australian populations at genes associated with desiccation tolerance. (A) and (C) represent SumStat scores for 5000 sets of control genes (distribution) and observed SumStat score (dashed red line) for genes associated with desiccation tolerance among populations sampled along the east coast of North America or Australia, respectively. (B) and (D) represent per-gene probabilities that the observed zst(g) values are bigger than expected by chance for North American and Australian populations, respectively. See Materials and Methods for a description of the SumStat score.
