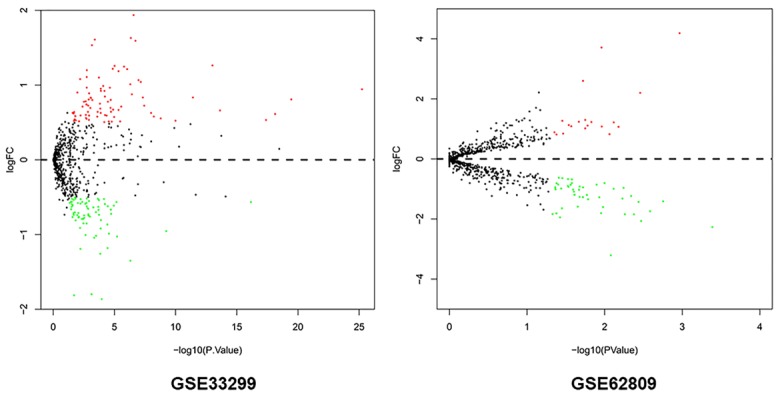
Figure 1.

Volcano plots of miRNAs between OLK-OSCC tissues and OLK tissues. X-axis indicates the p values (log-scaled), whereas the Y-axis shows the fold change (log-scaled). Each symbol represents a different miRNA, and the red/green color of the symbols categorize the upregulated/downregulated miRNAs.
