
Figure 3.
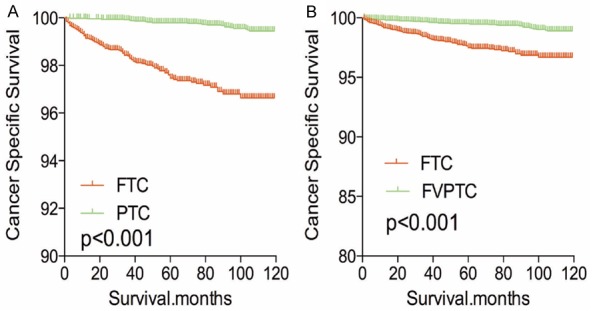
Kaplan Meier curves of cancer-specific mortality for matched subtype pairs. Age, sex, race, T/N/M stage, multifocality, extension matched between FTC and PTC (A), FTC and FVPTC (B).
Official websites use .gov
A
.gov website belongs to an official
government organization in the United States.
Secure .gov websites use HTTPS
A lock (
) or https:// means you've safely
connected to the .gov website. Share sensitive
information only on official, secure websites.
Kaplan Meier curves of cancer-specific mortality for matched subtype pairs. Age, sex, race, T/N/M stage, multifocality, extension matched between FTC and PTC (A), FTC and FVPTC (B).